Statistical Analysis
Statistical analysis of jobs from different dimensions.
Project Distribution
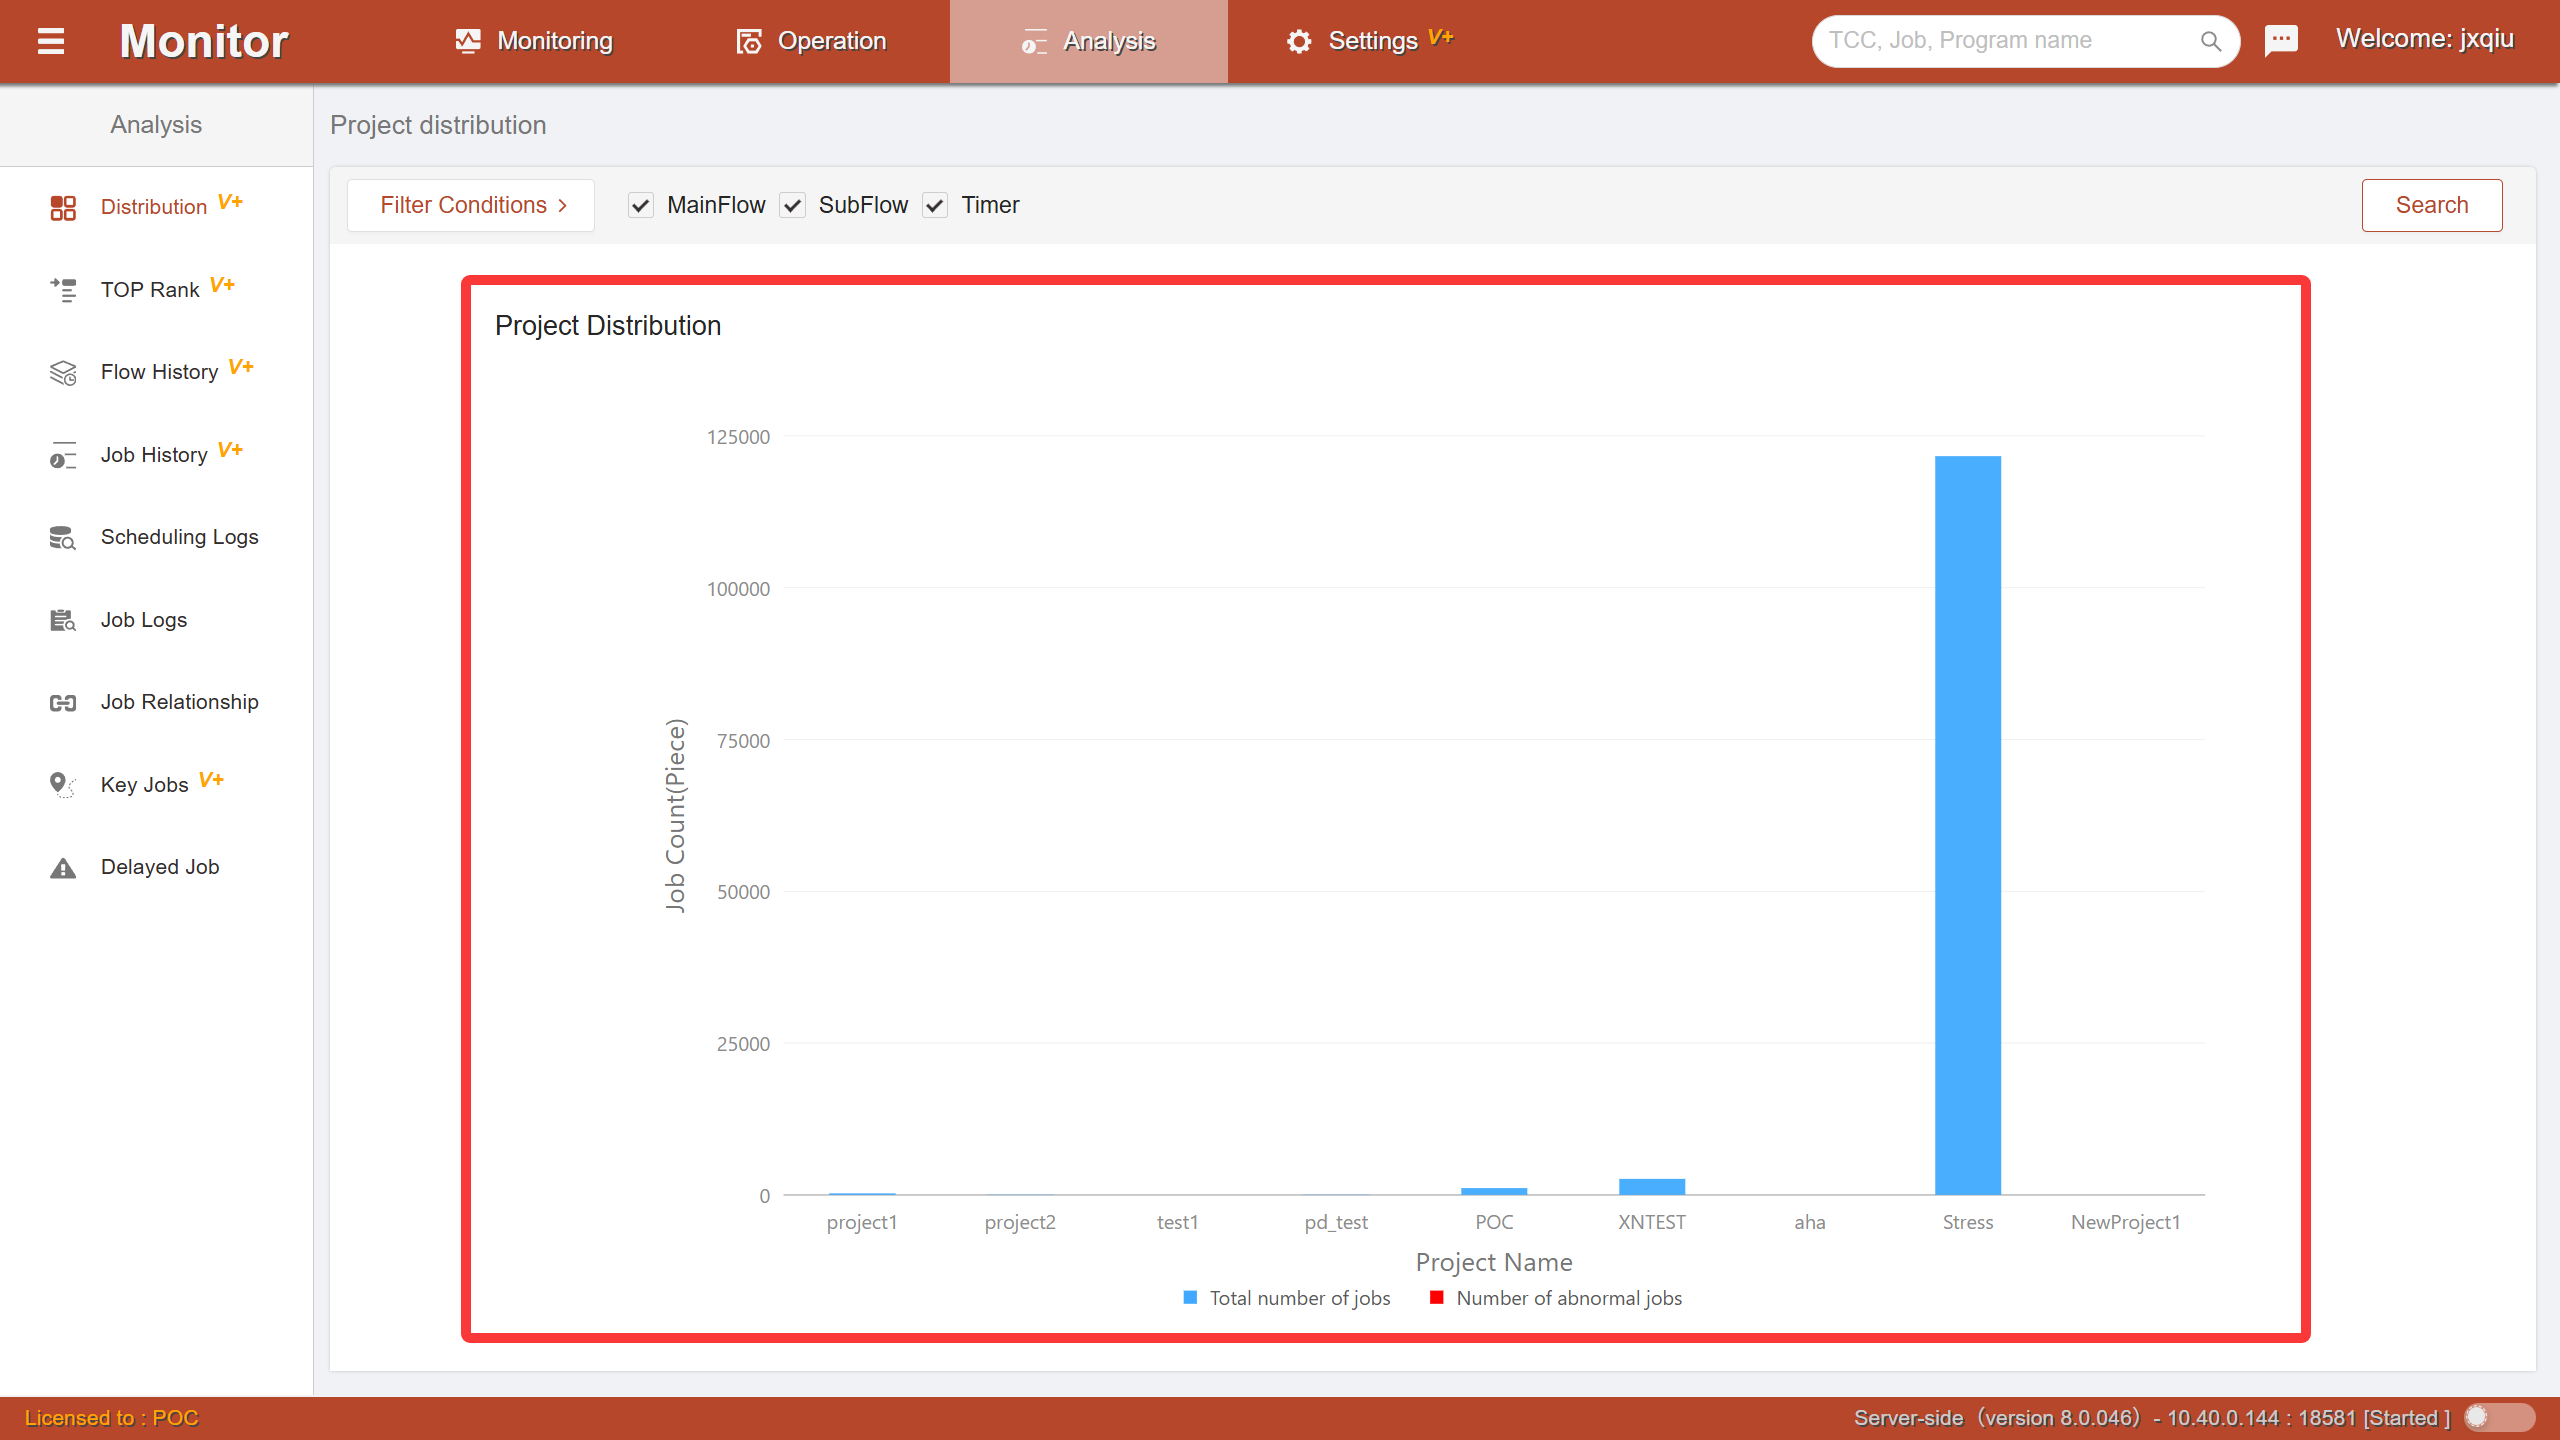
A bar chart displays the distribution count and abnormal count of platform jobs under each project. Helps users analyze the scale of application projects. The toolbar can select projects to display (up to 10 items) and filter by job container type. Double-click on a chart bar area to jump to the job monitoring page for the corresponding project and job container type.
Node Distribution
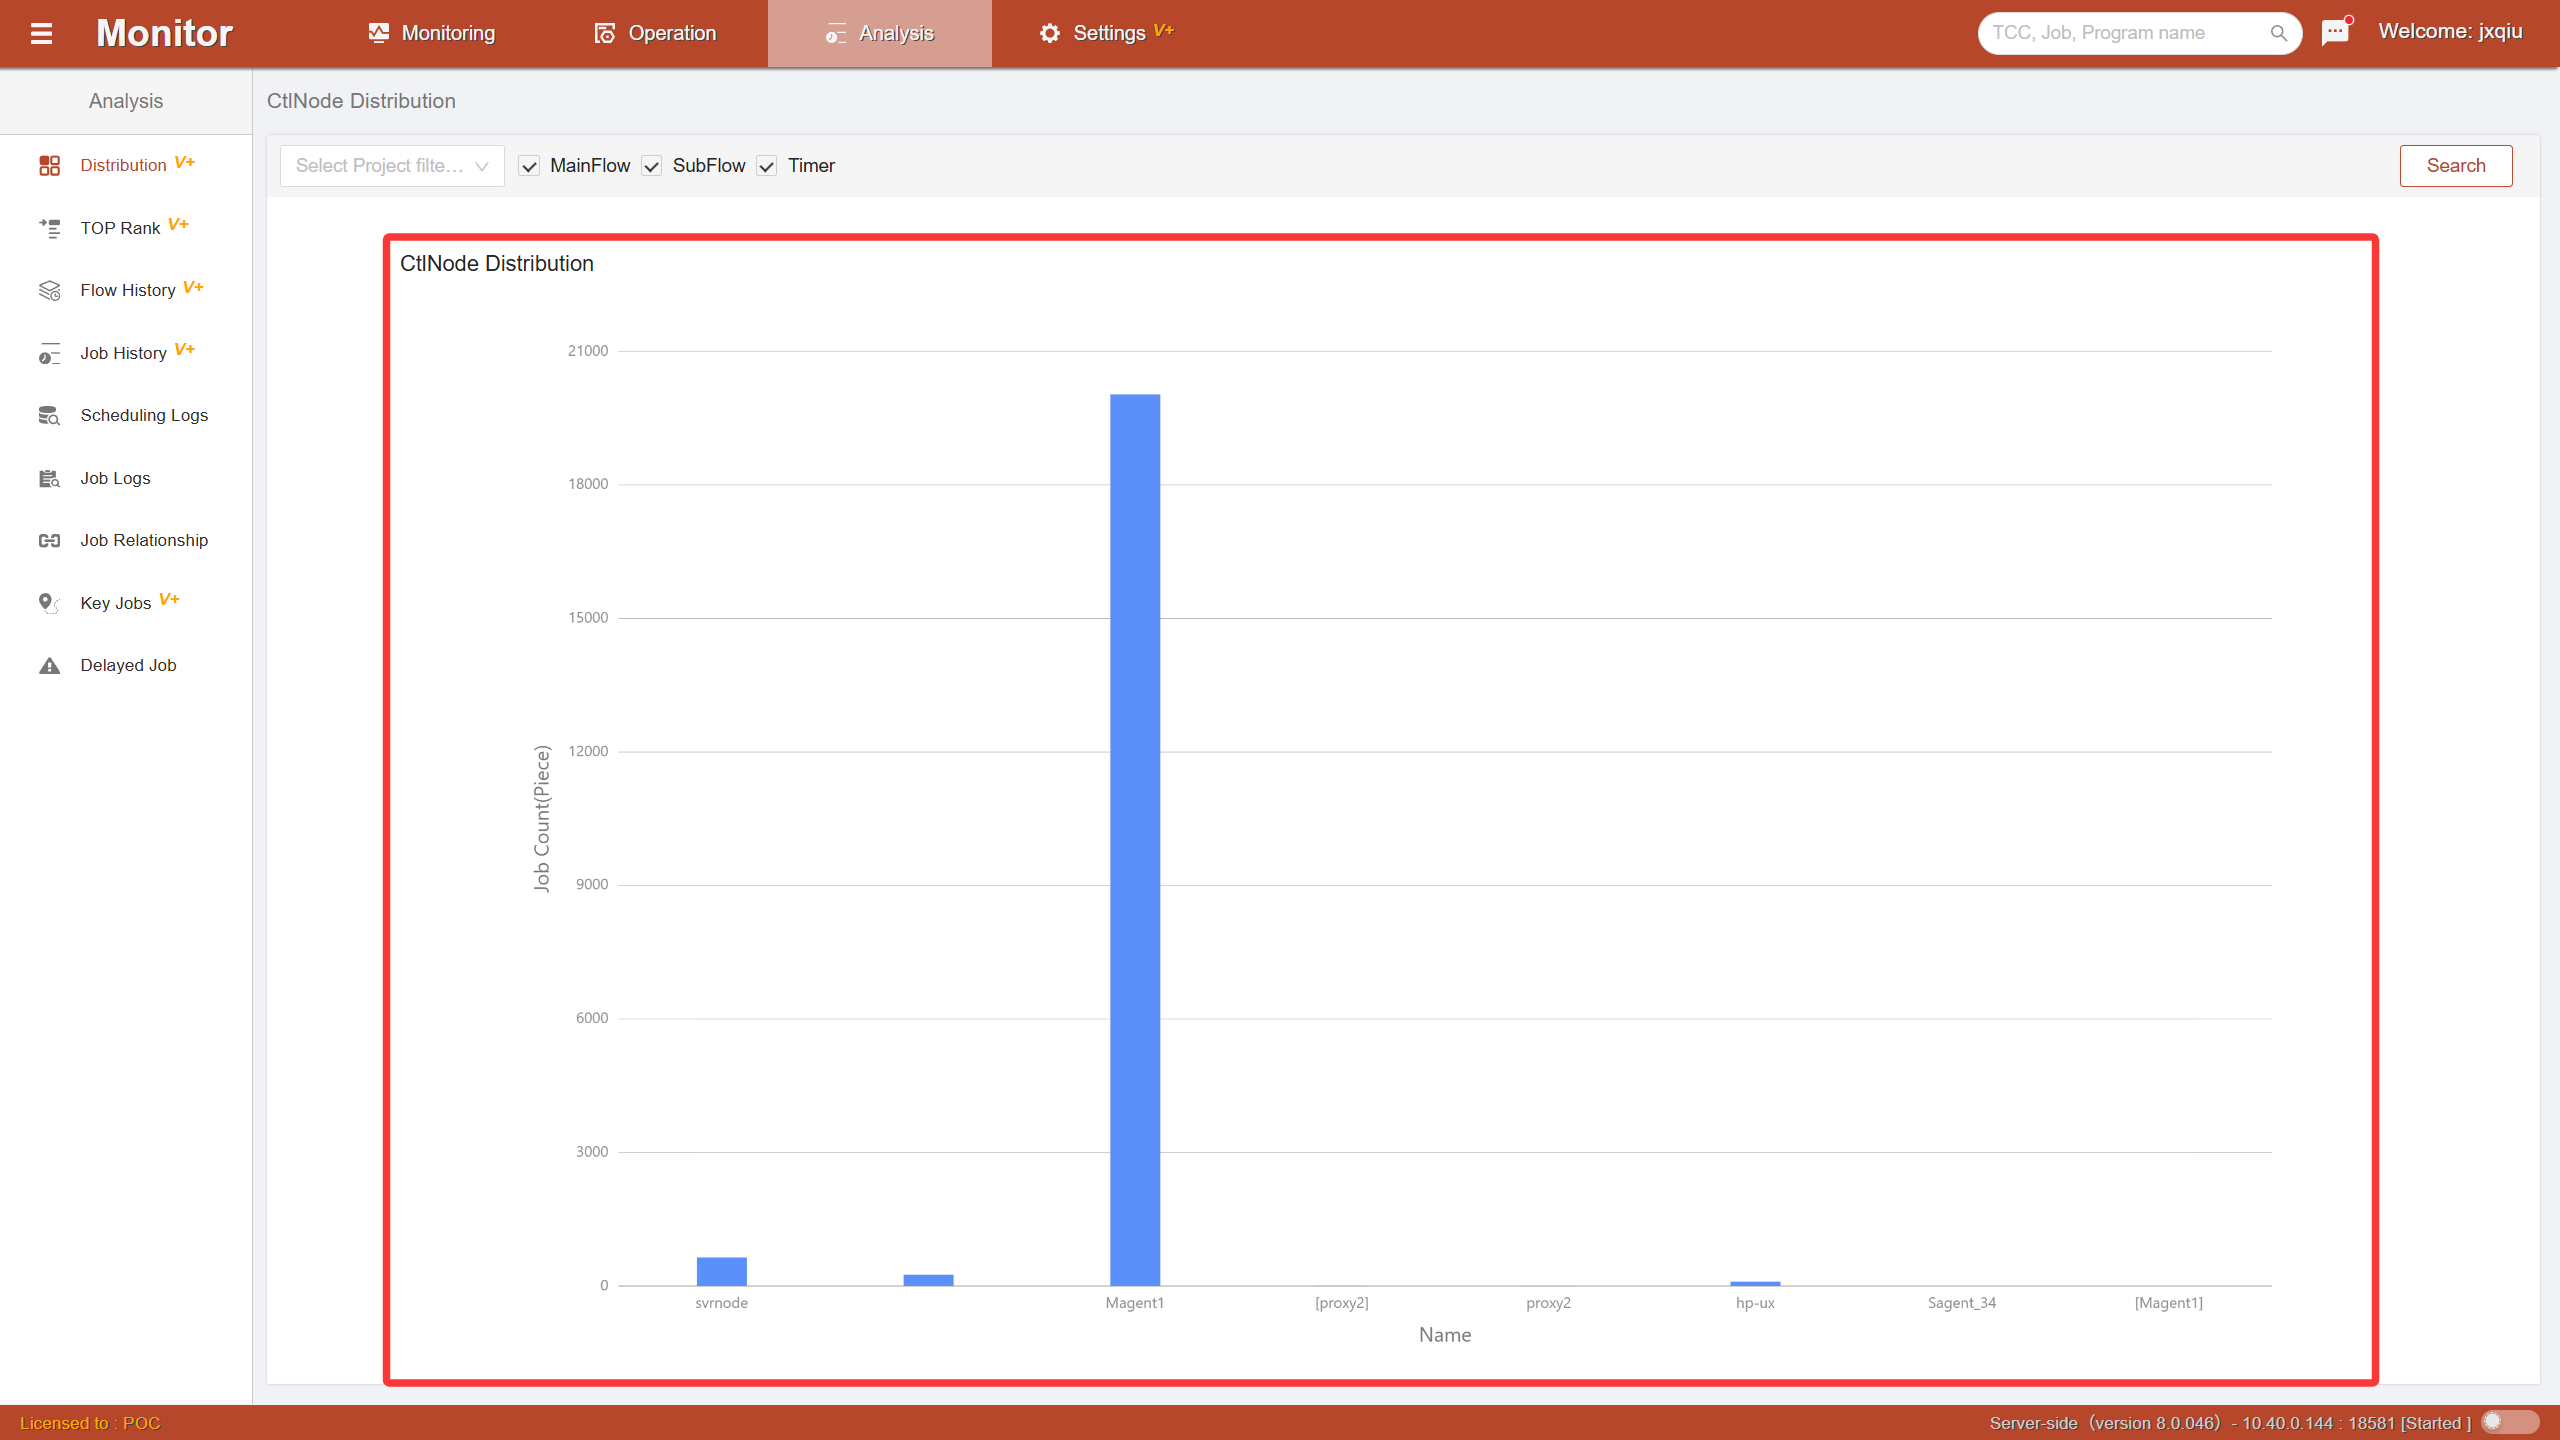
A bar chart displays the running count and proportion of platform jobs on each scheduling control node. The toolbar can filter by project and control container type. Double-click on a chart bar area to jump to the job monitoring page for the corresponding control node.
Type Distribution
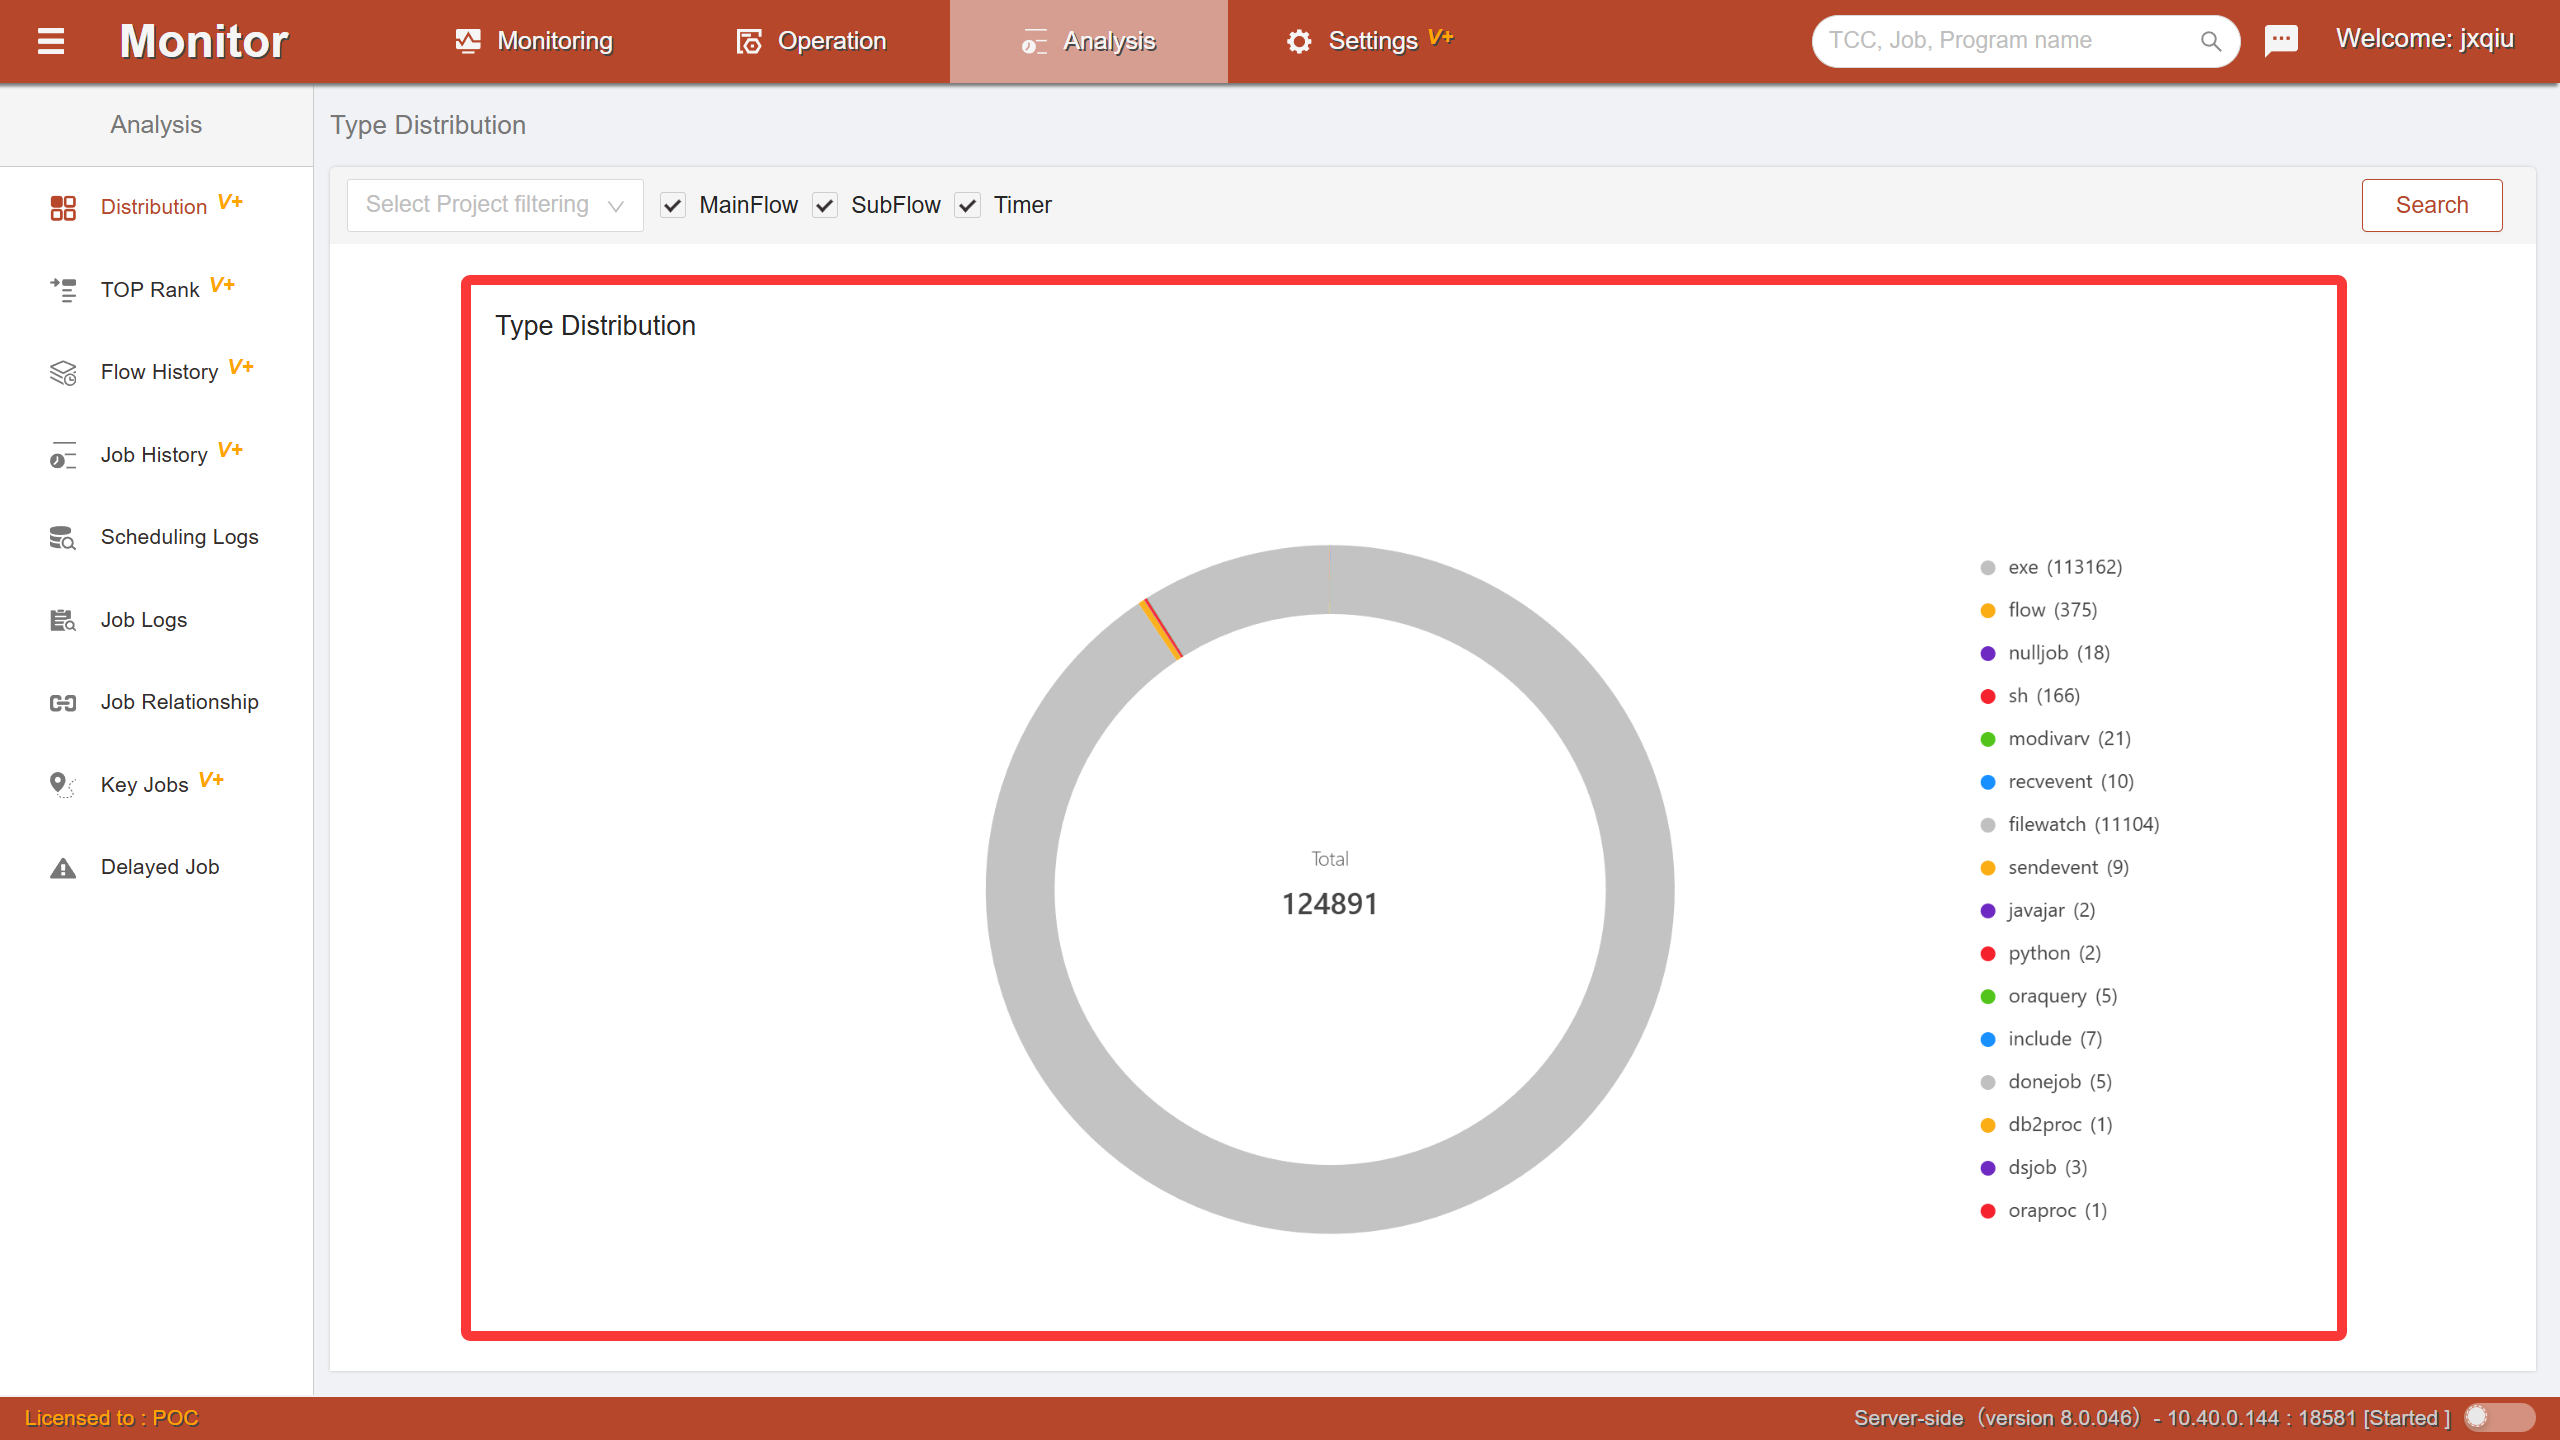
A donut chart displays the count and proportion of various job types. The toolbar can filter by project and control container type. Double-click on a chart sector to jump to the job monitoring page for the corresponding type.
Time Distribution
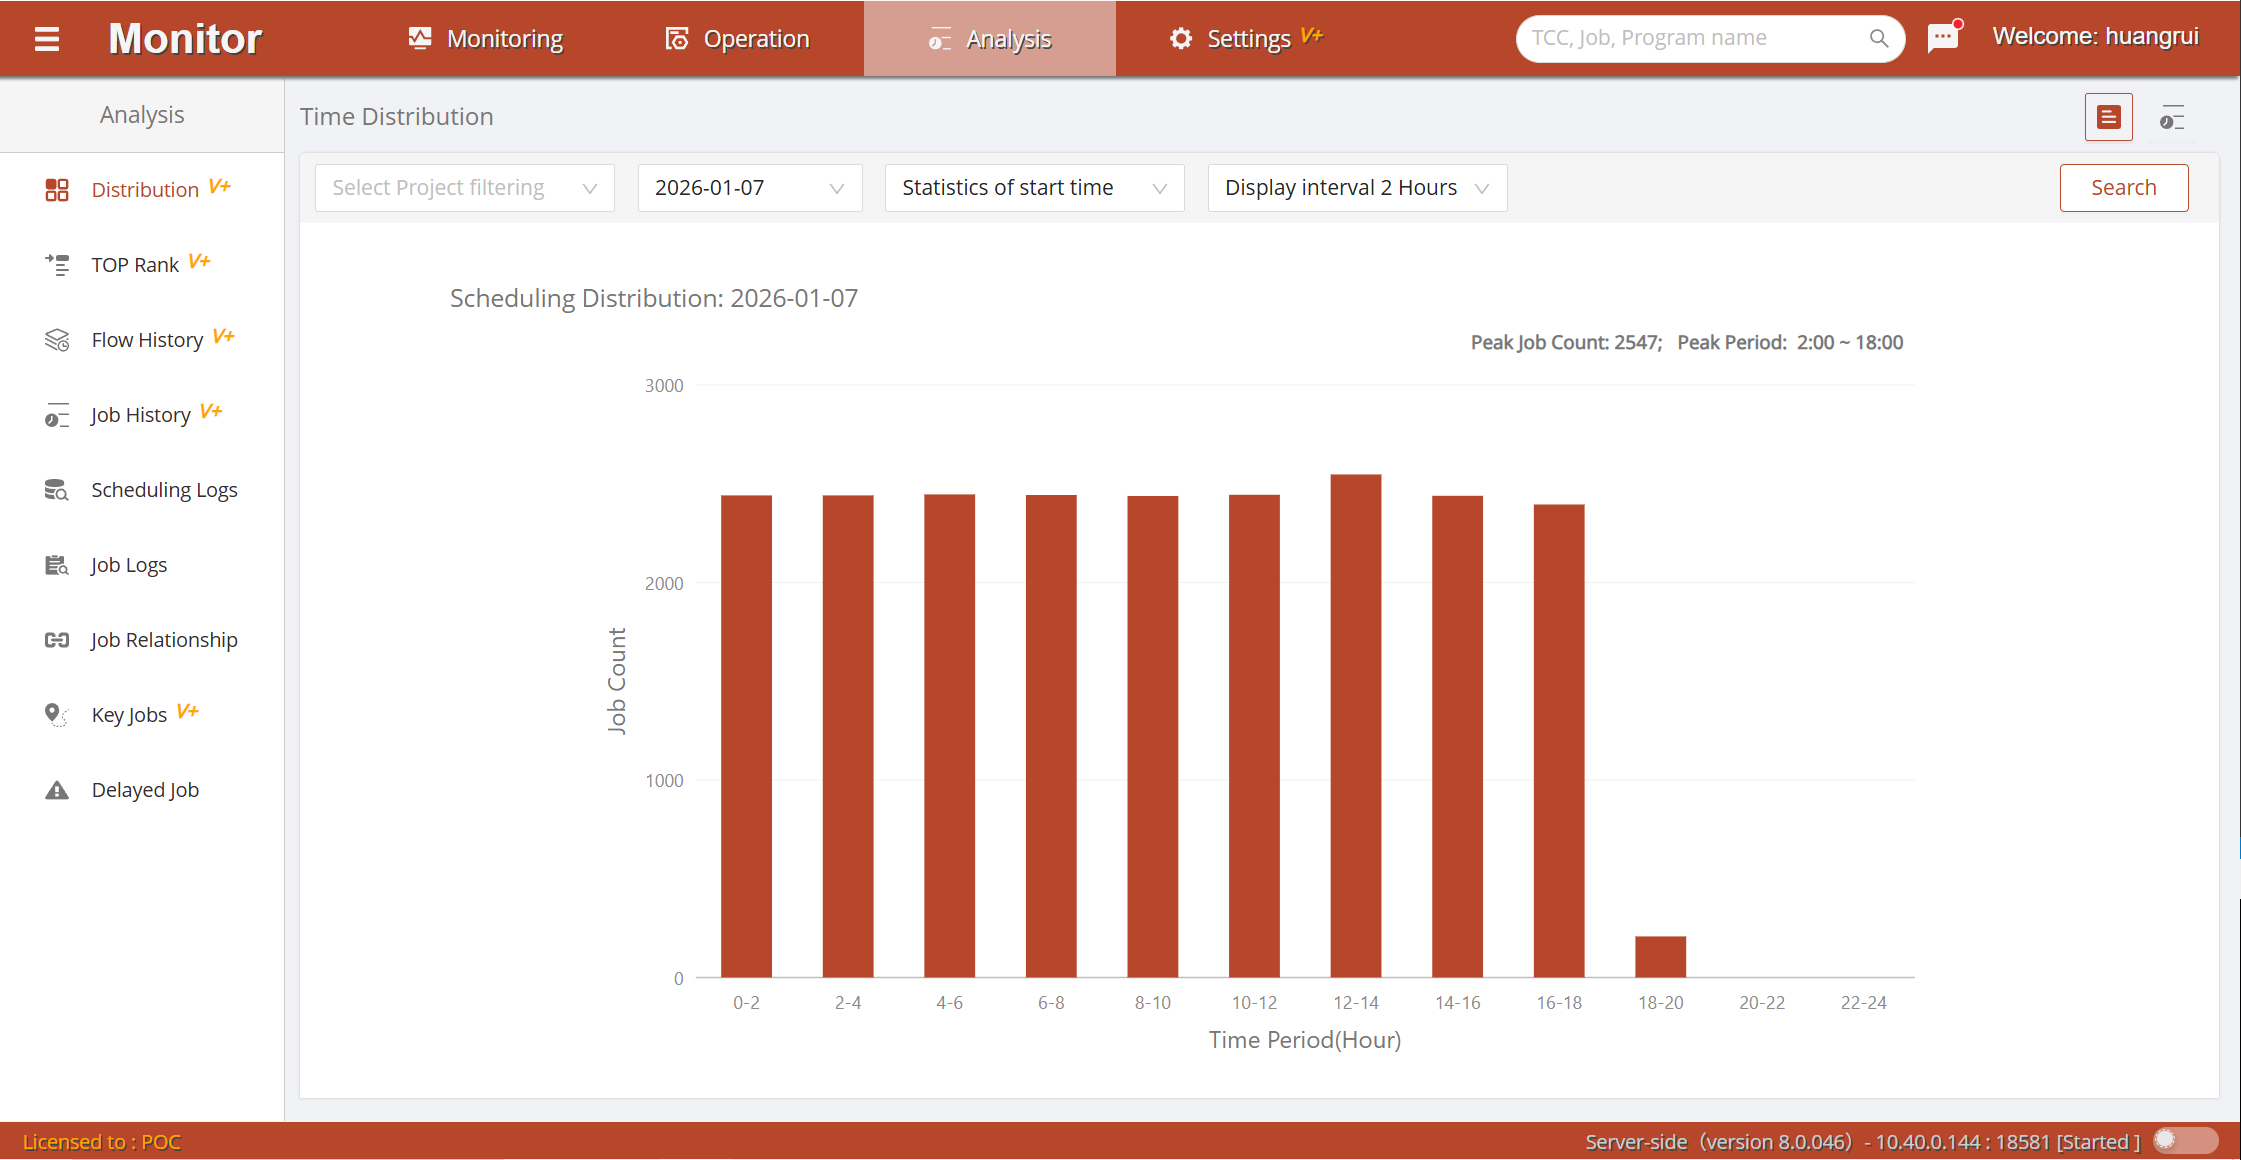
A bar chart displays the platform jobs' running distribution across time periods throughout the day, with a two-hour span for each period, as well as peak areas. Helps users analyze which time periods of the day have heavy business processing, so as to optimize the business processing time window.
The toolbar allows selecting the statistical date. Double-click on a chart bar area to jump to the job history record list for the corresponding time period.
Long-Running Rankings
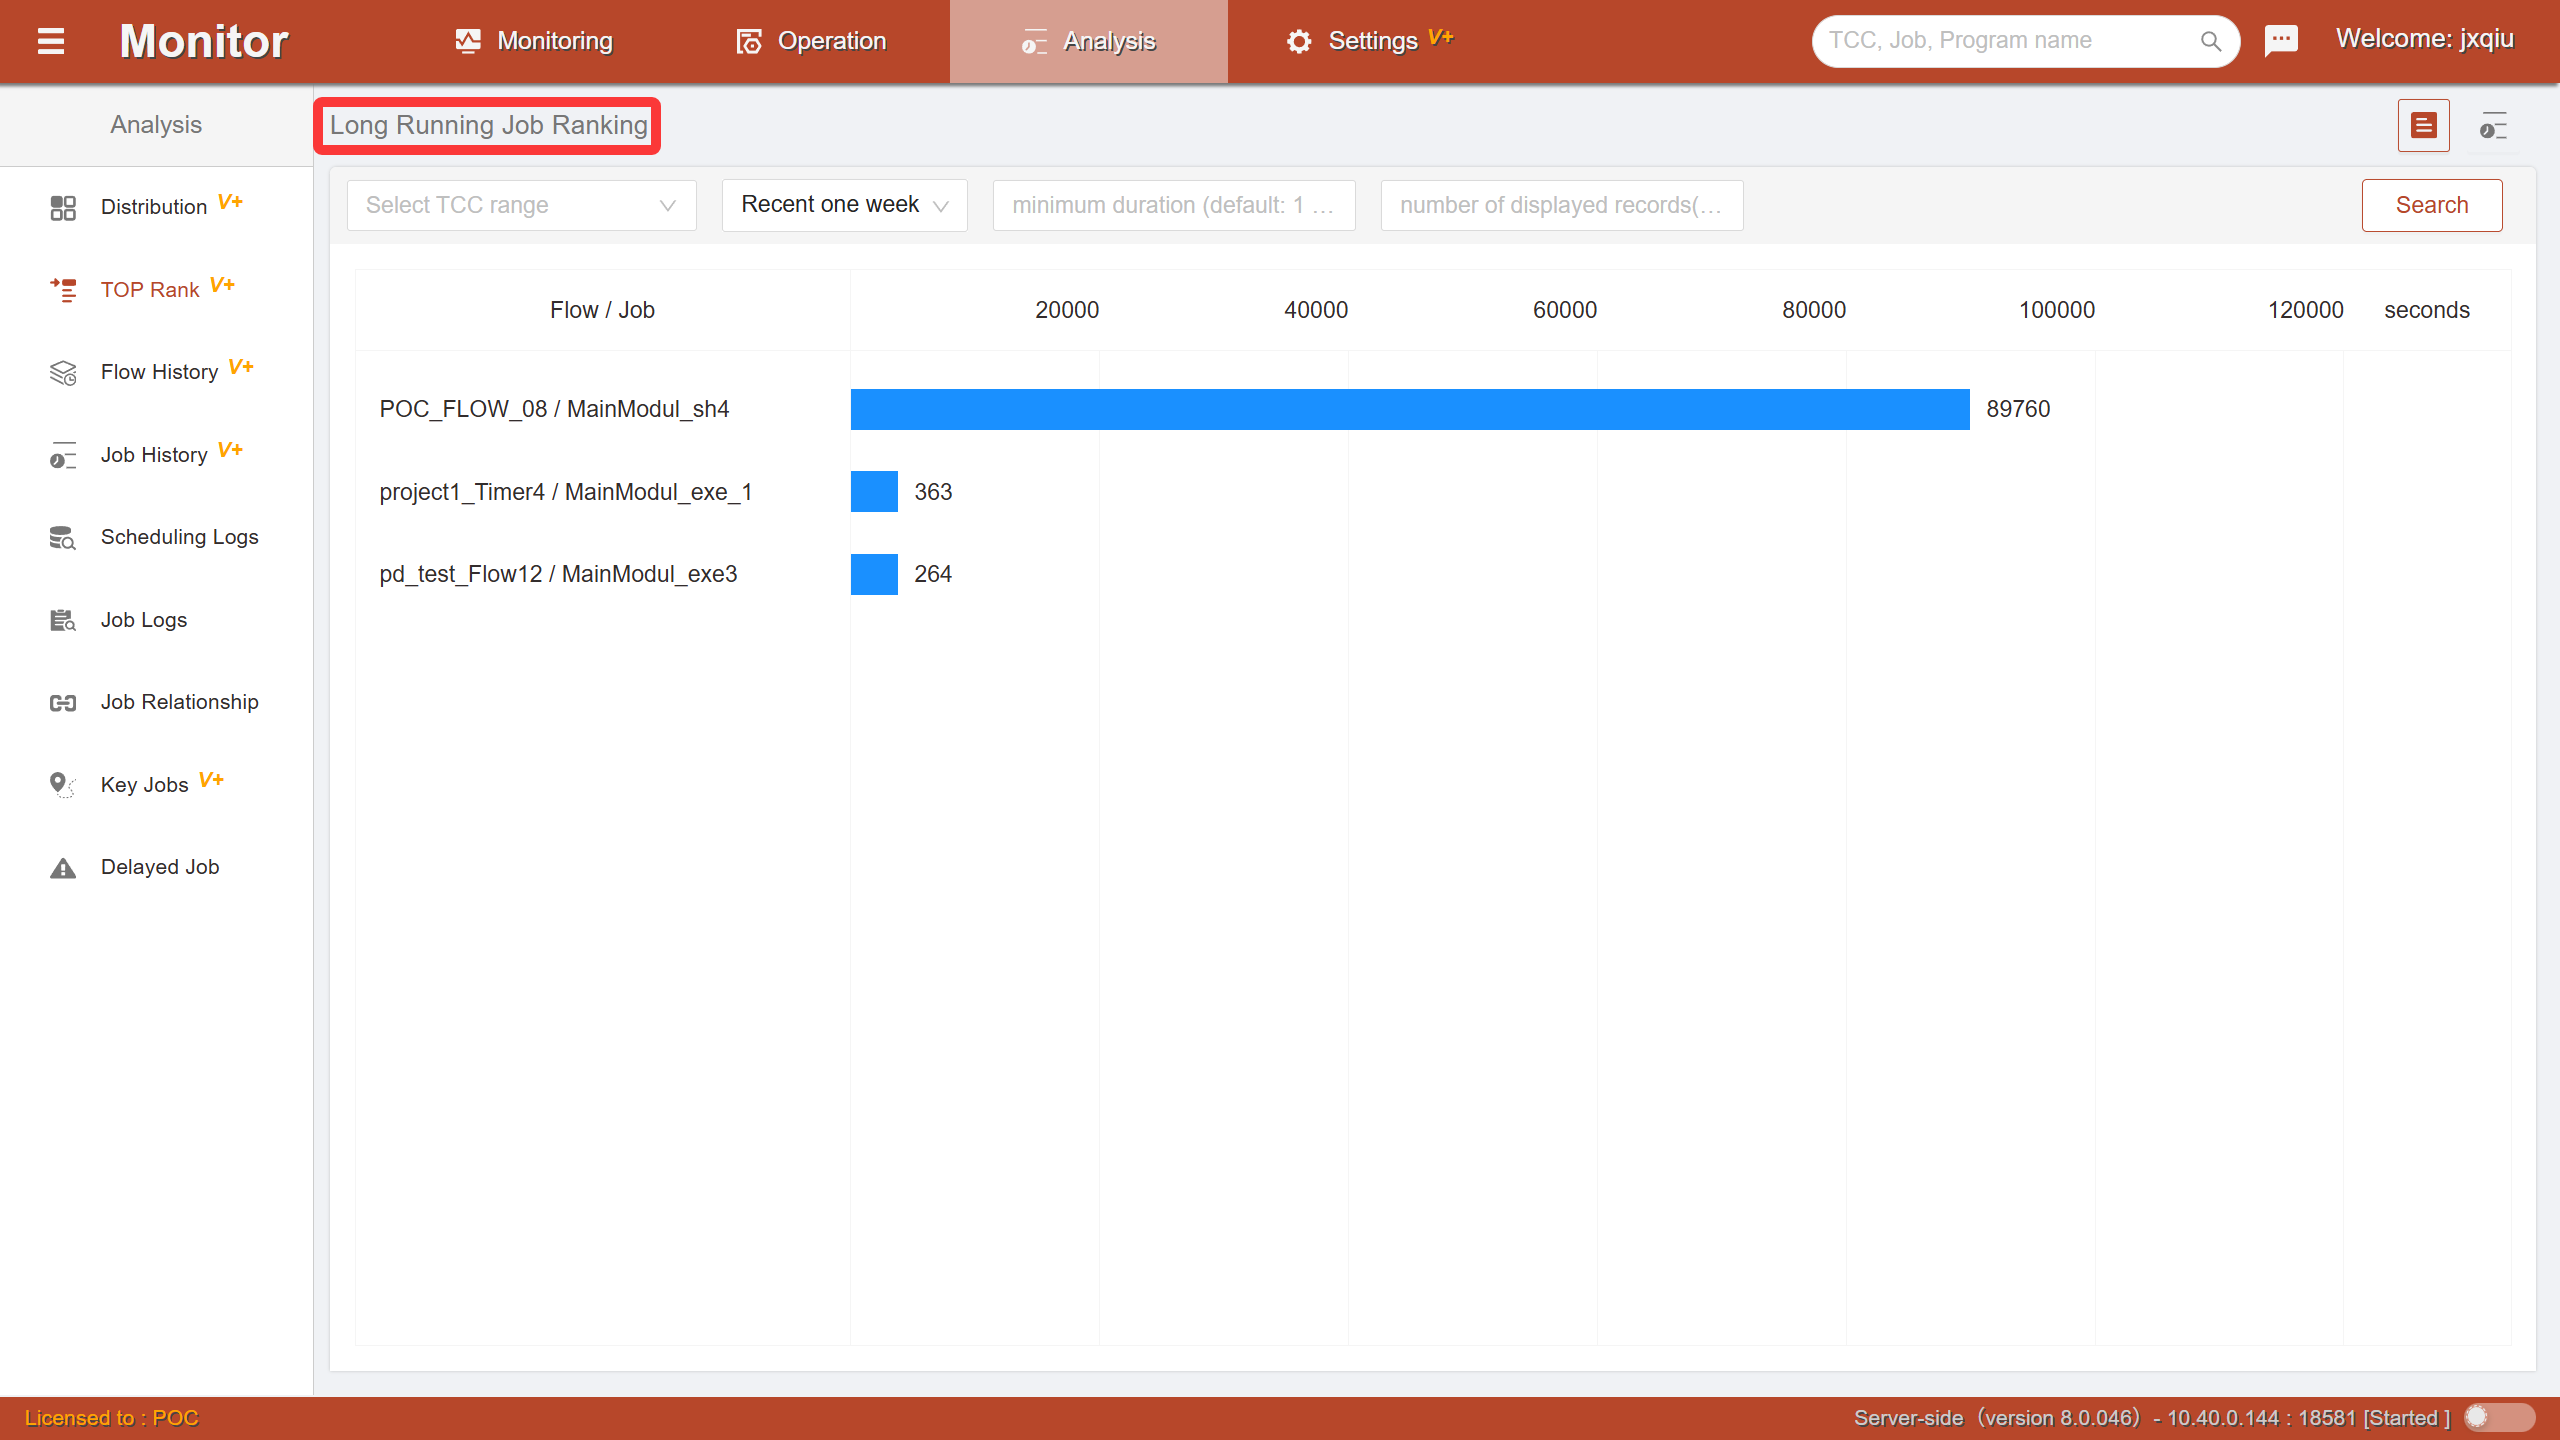
After workflows run for a period of time, there will be relatively stable running window data, including running duration, start and end times, etc. As the name suggests, Long-Running Rankings displays the most time-consuming jobs on the platform. By referencing this information, you can get a more intuitive understanding of the running bottlenecks of scheduling workflows. It provides data support for optimizing scheduling running time windows.
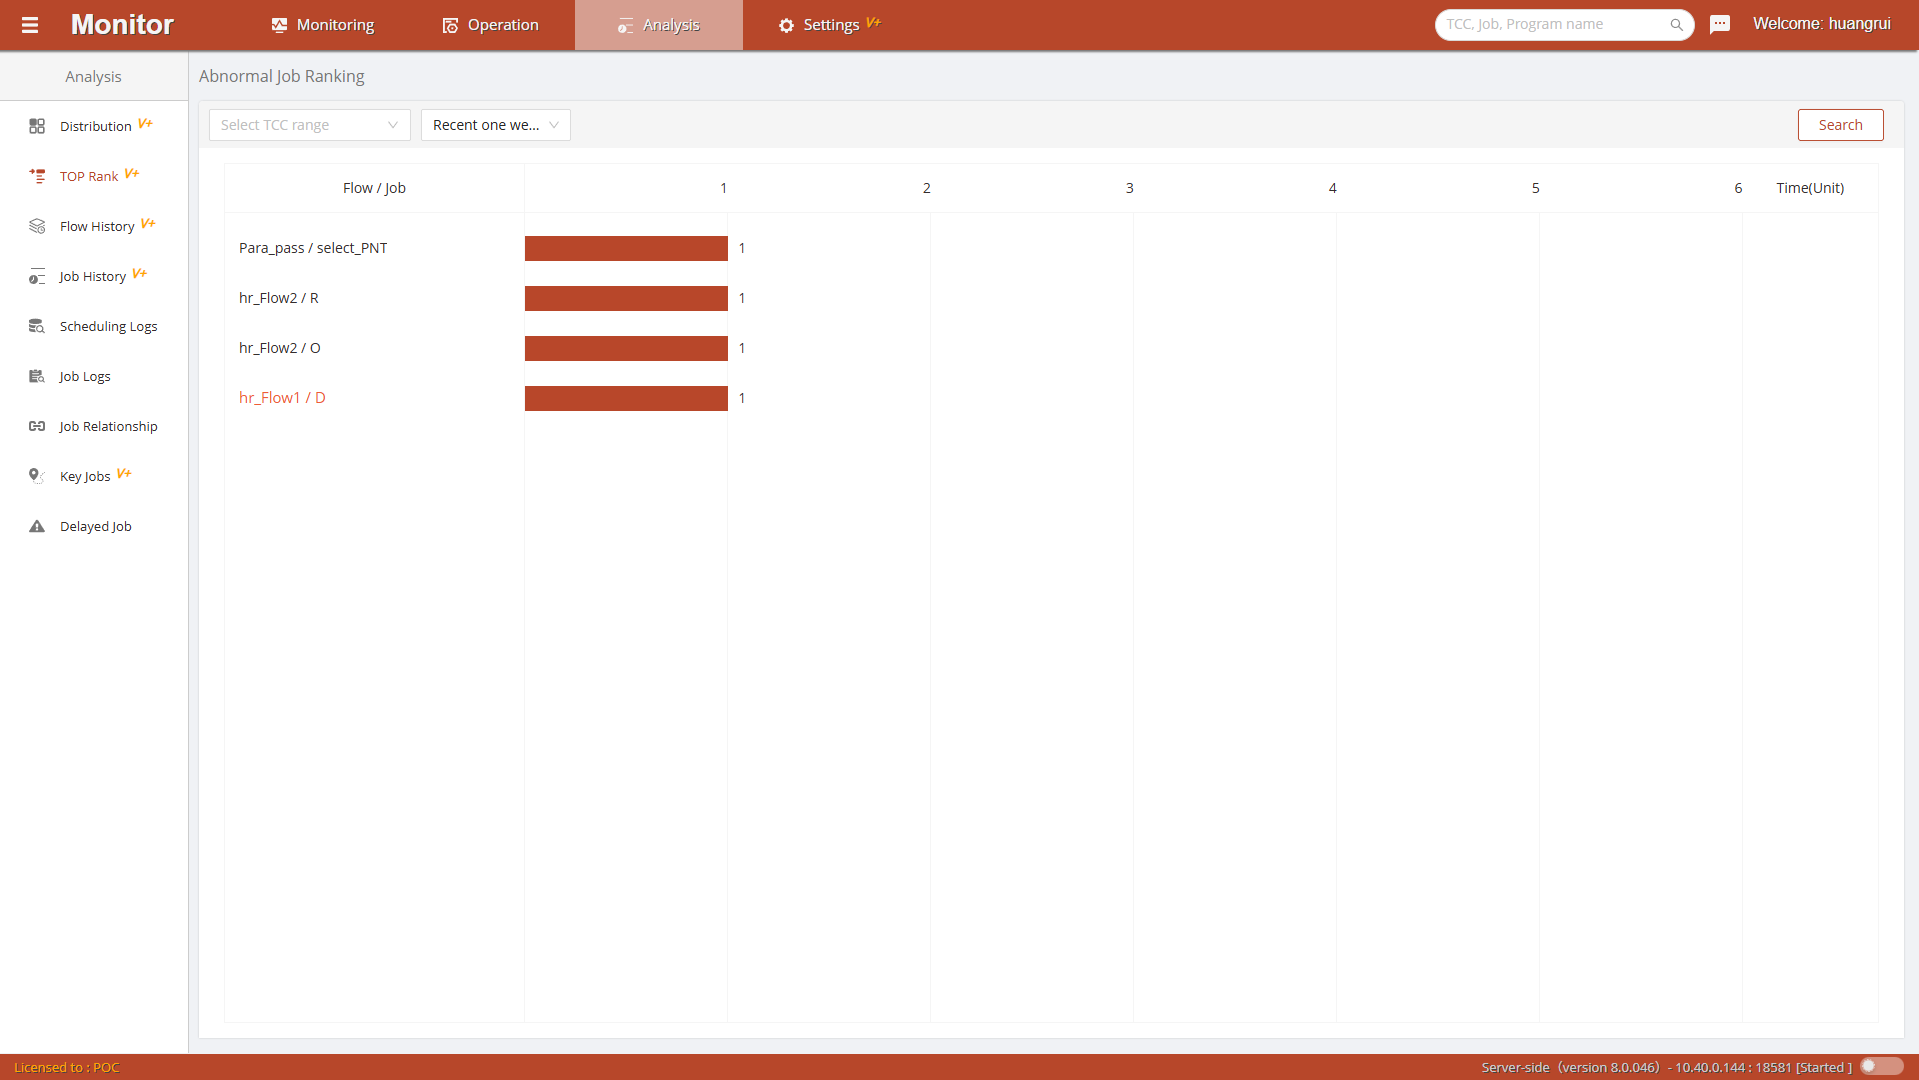
Exception Rankings
Displays the exception job count ranking statistics for the overall platform. Exception jobs are the most critical factor affecting the stability and robustness of the scheduling system.