Run Monitoring
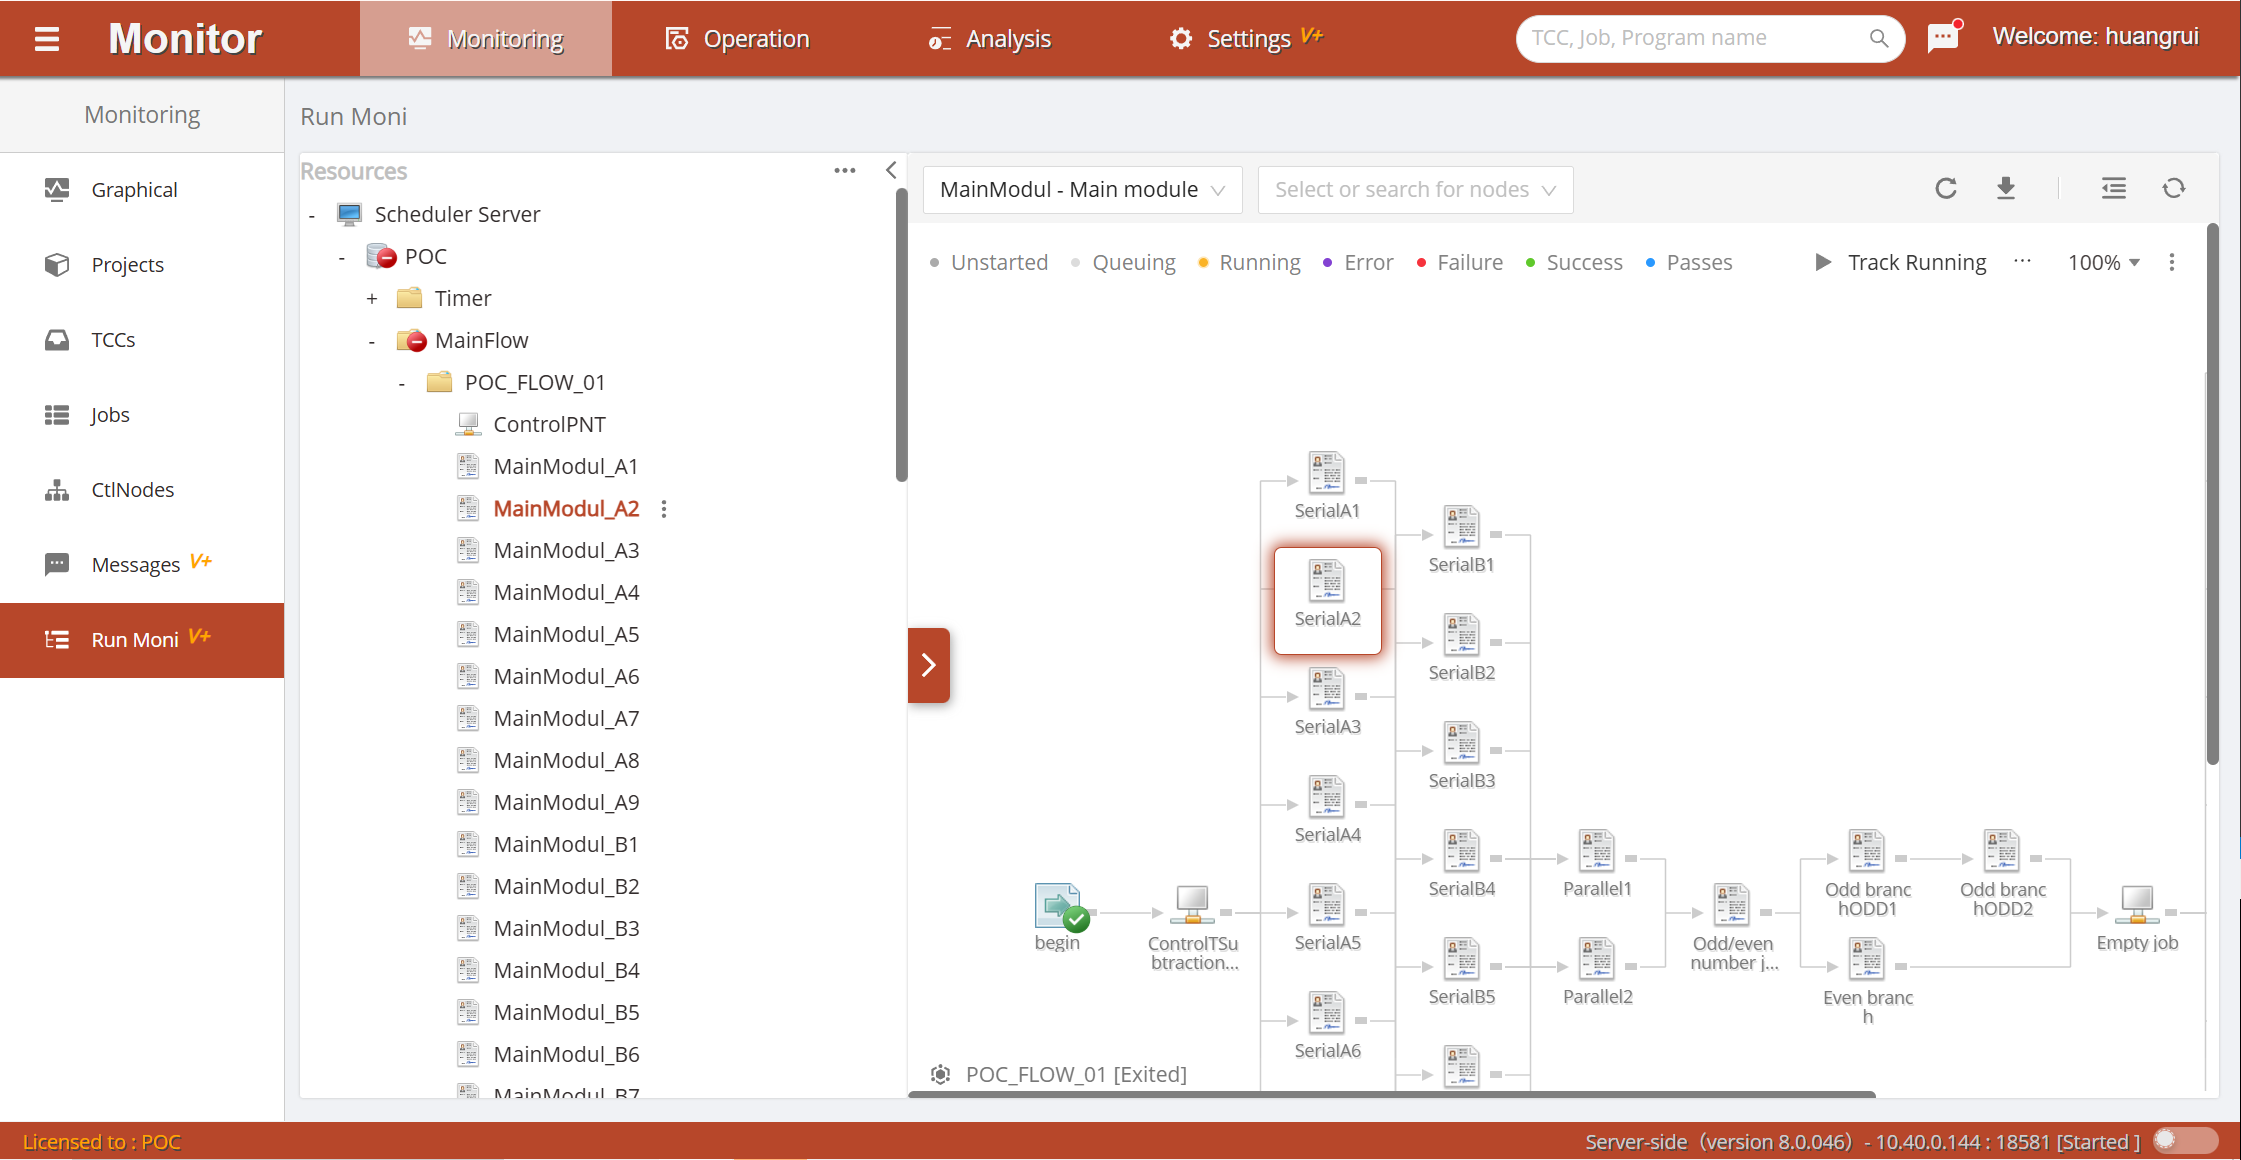
The run monitoring page uses a left-right split layout to uniformly monitor and visually display the running status of objects at different levels in the scheduling system. A tree structure is used to display system resource hierarchy, with levels in order: Platform → Project → Workflow → Job.
Platform Level
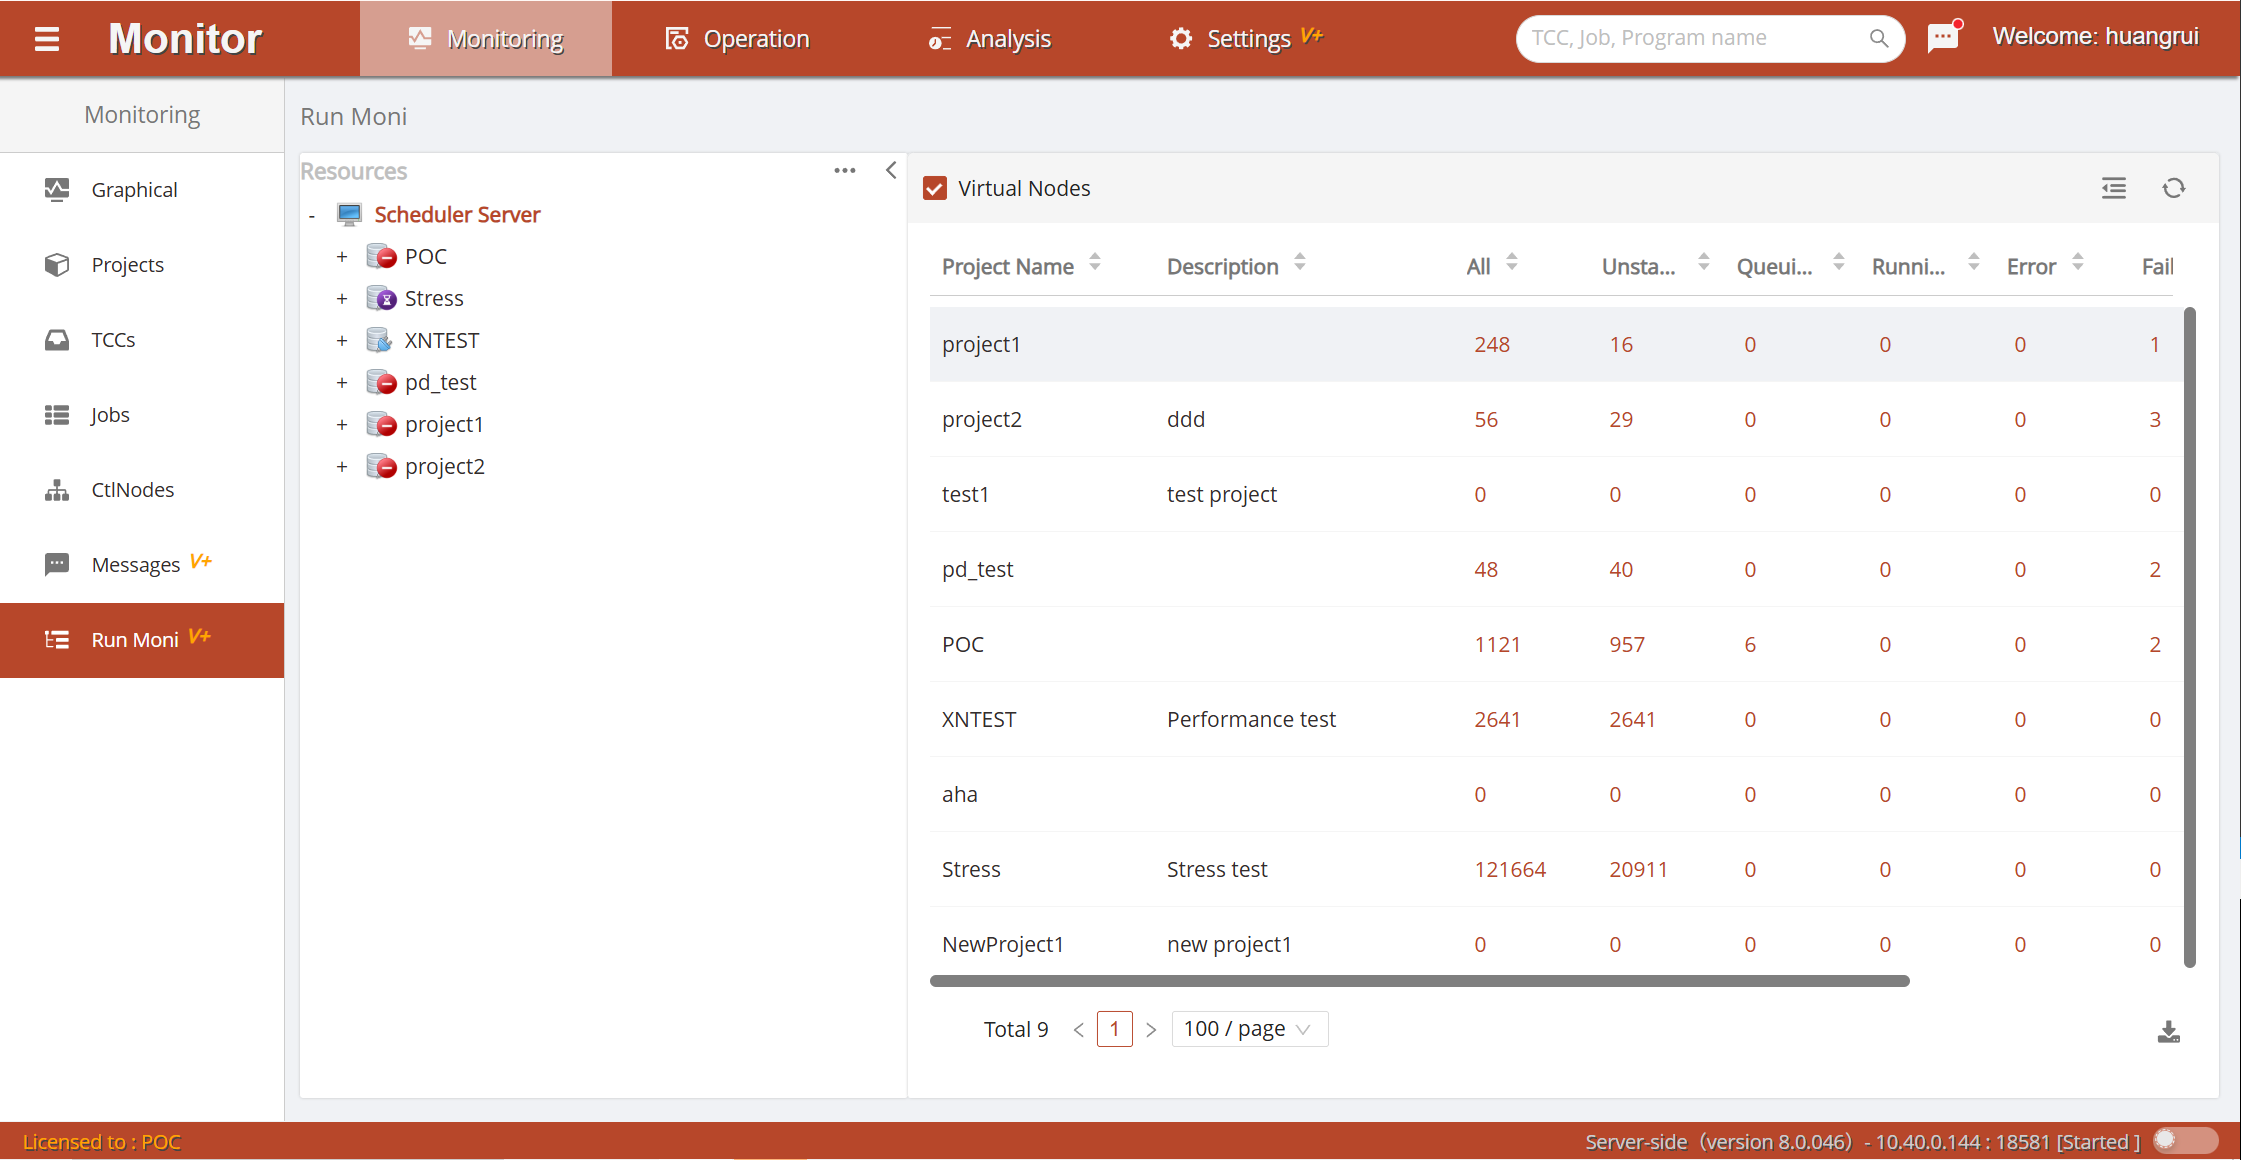
Displays job running statistics for each project under the platform, including total job count and job count distribution across different running statuses such as success, failure, and error.
Project Level
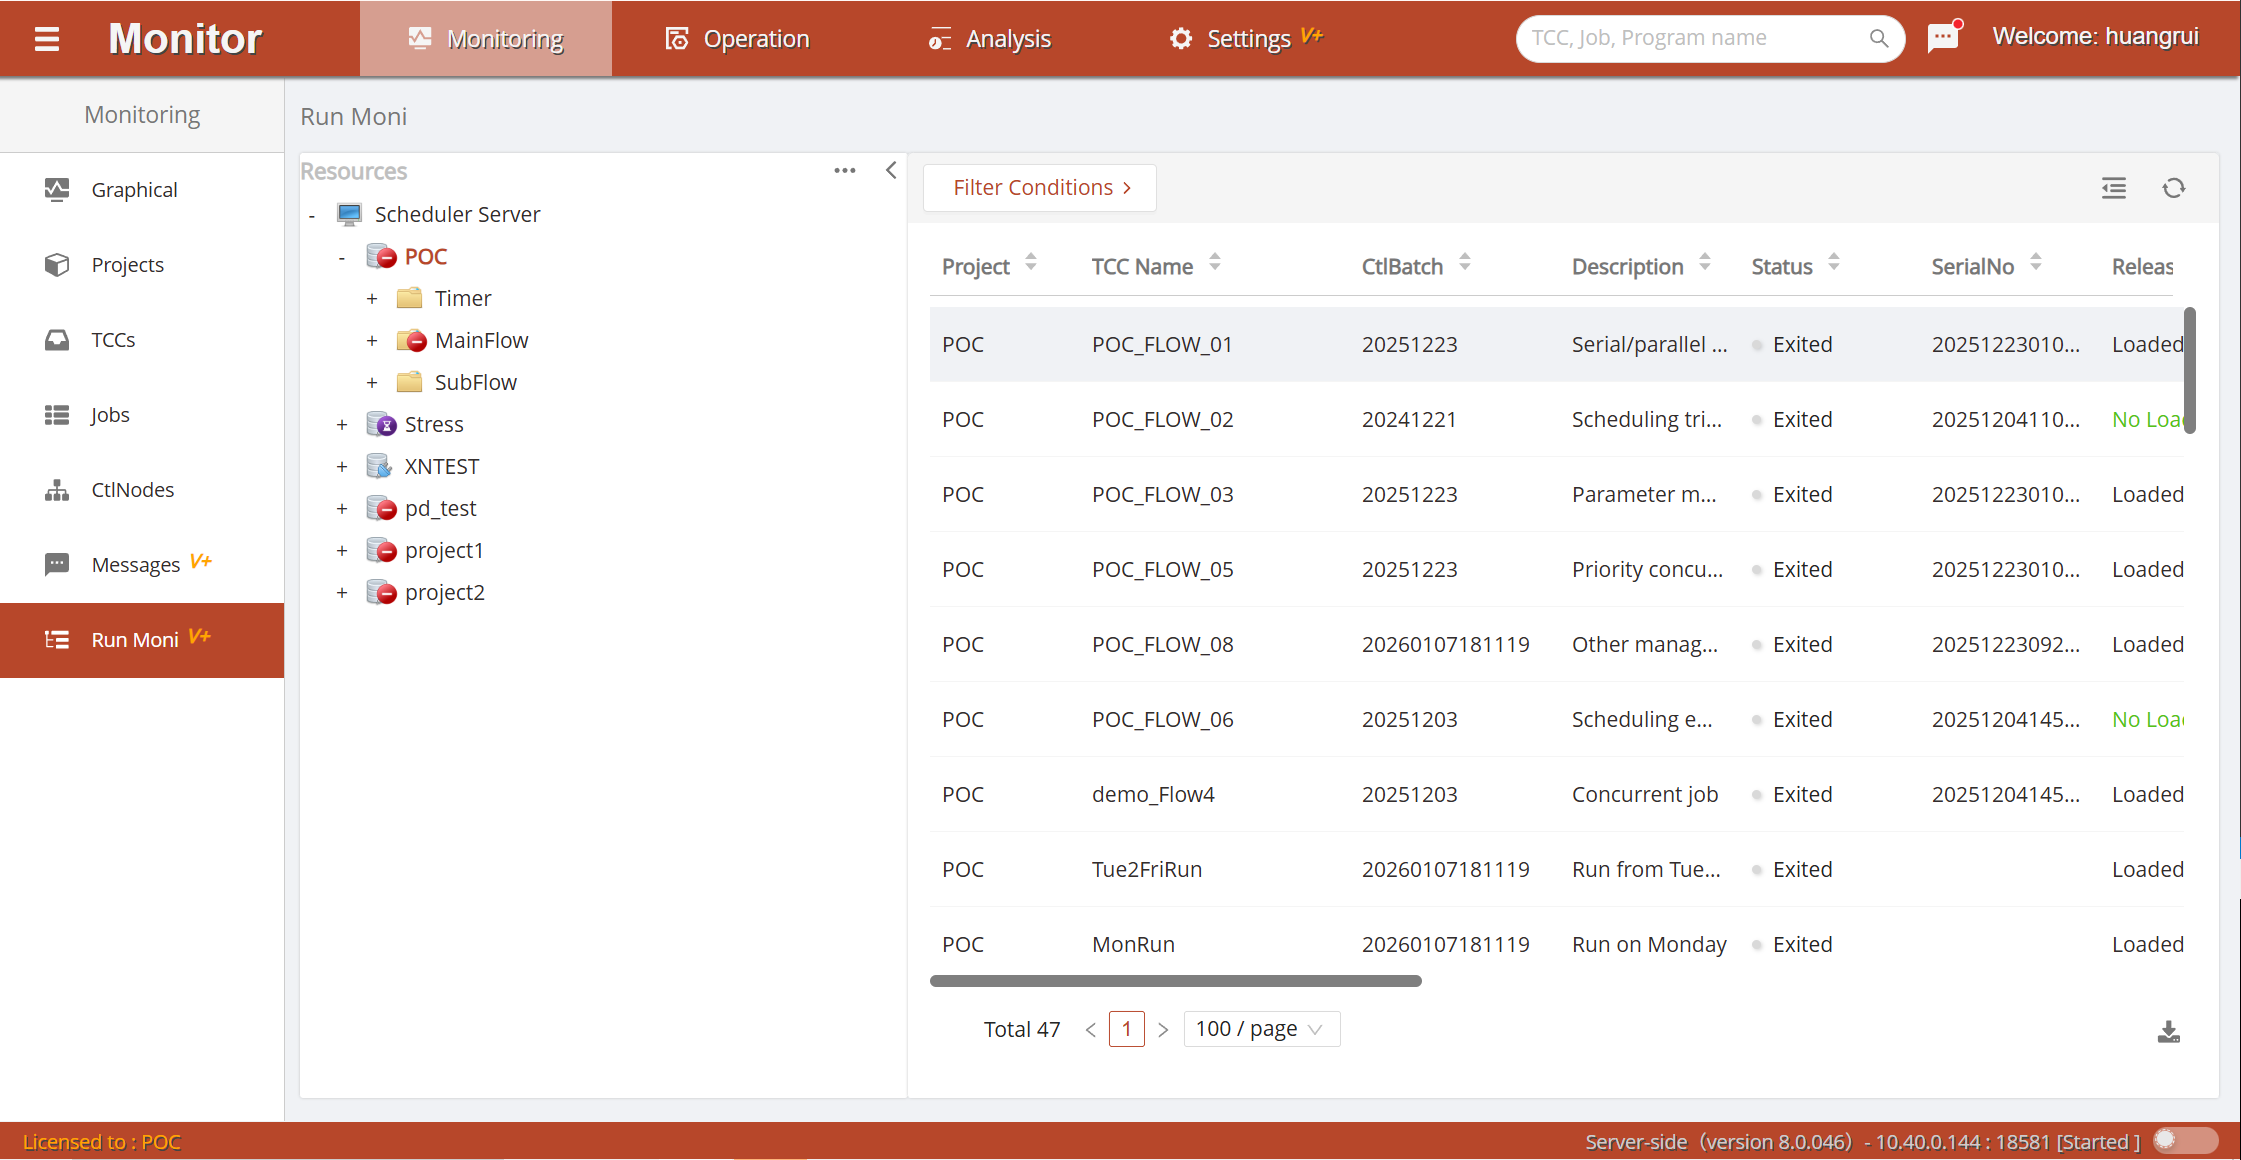
Displays job running status statistics for each workflow under the project, summarizing job count and status distribution by workflow dimension.
Workflow Level
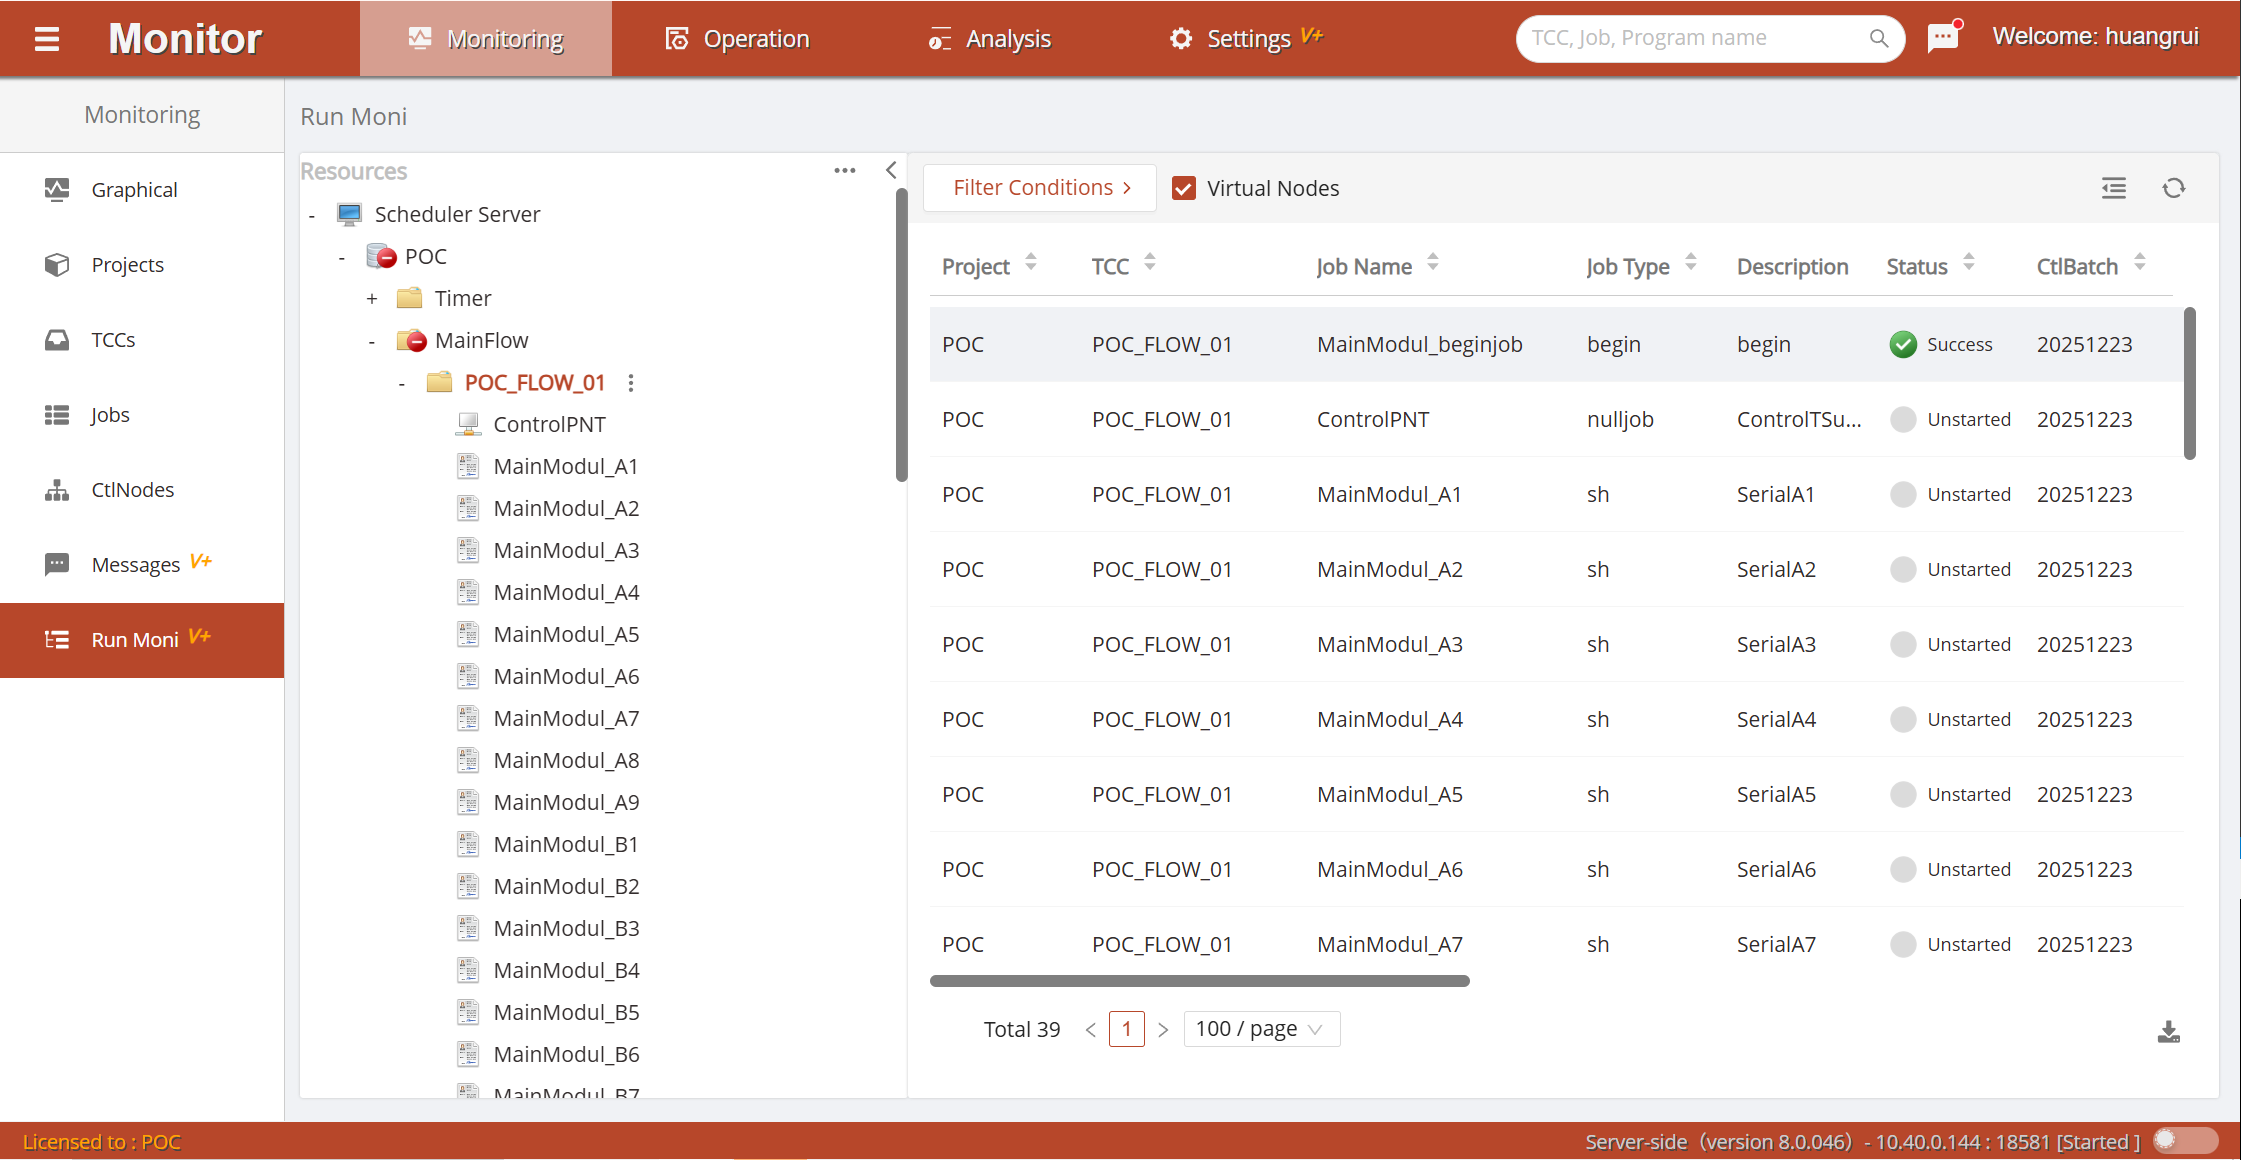
Displays detailed running status information for all jobs under a workflow in table form, including job name, current status, etc.
Job Level
Displays the job dependency relationships of a workflow using a DAG (Directed Acyclic Graph), and visually marks the real-time running status of each job in the diagram, achieving visual monitoring of workflow execution.