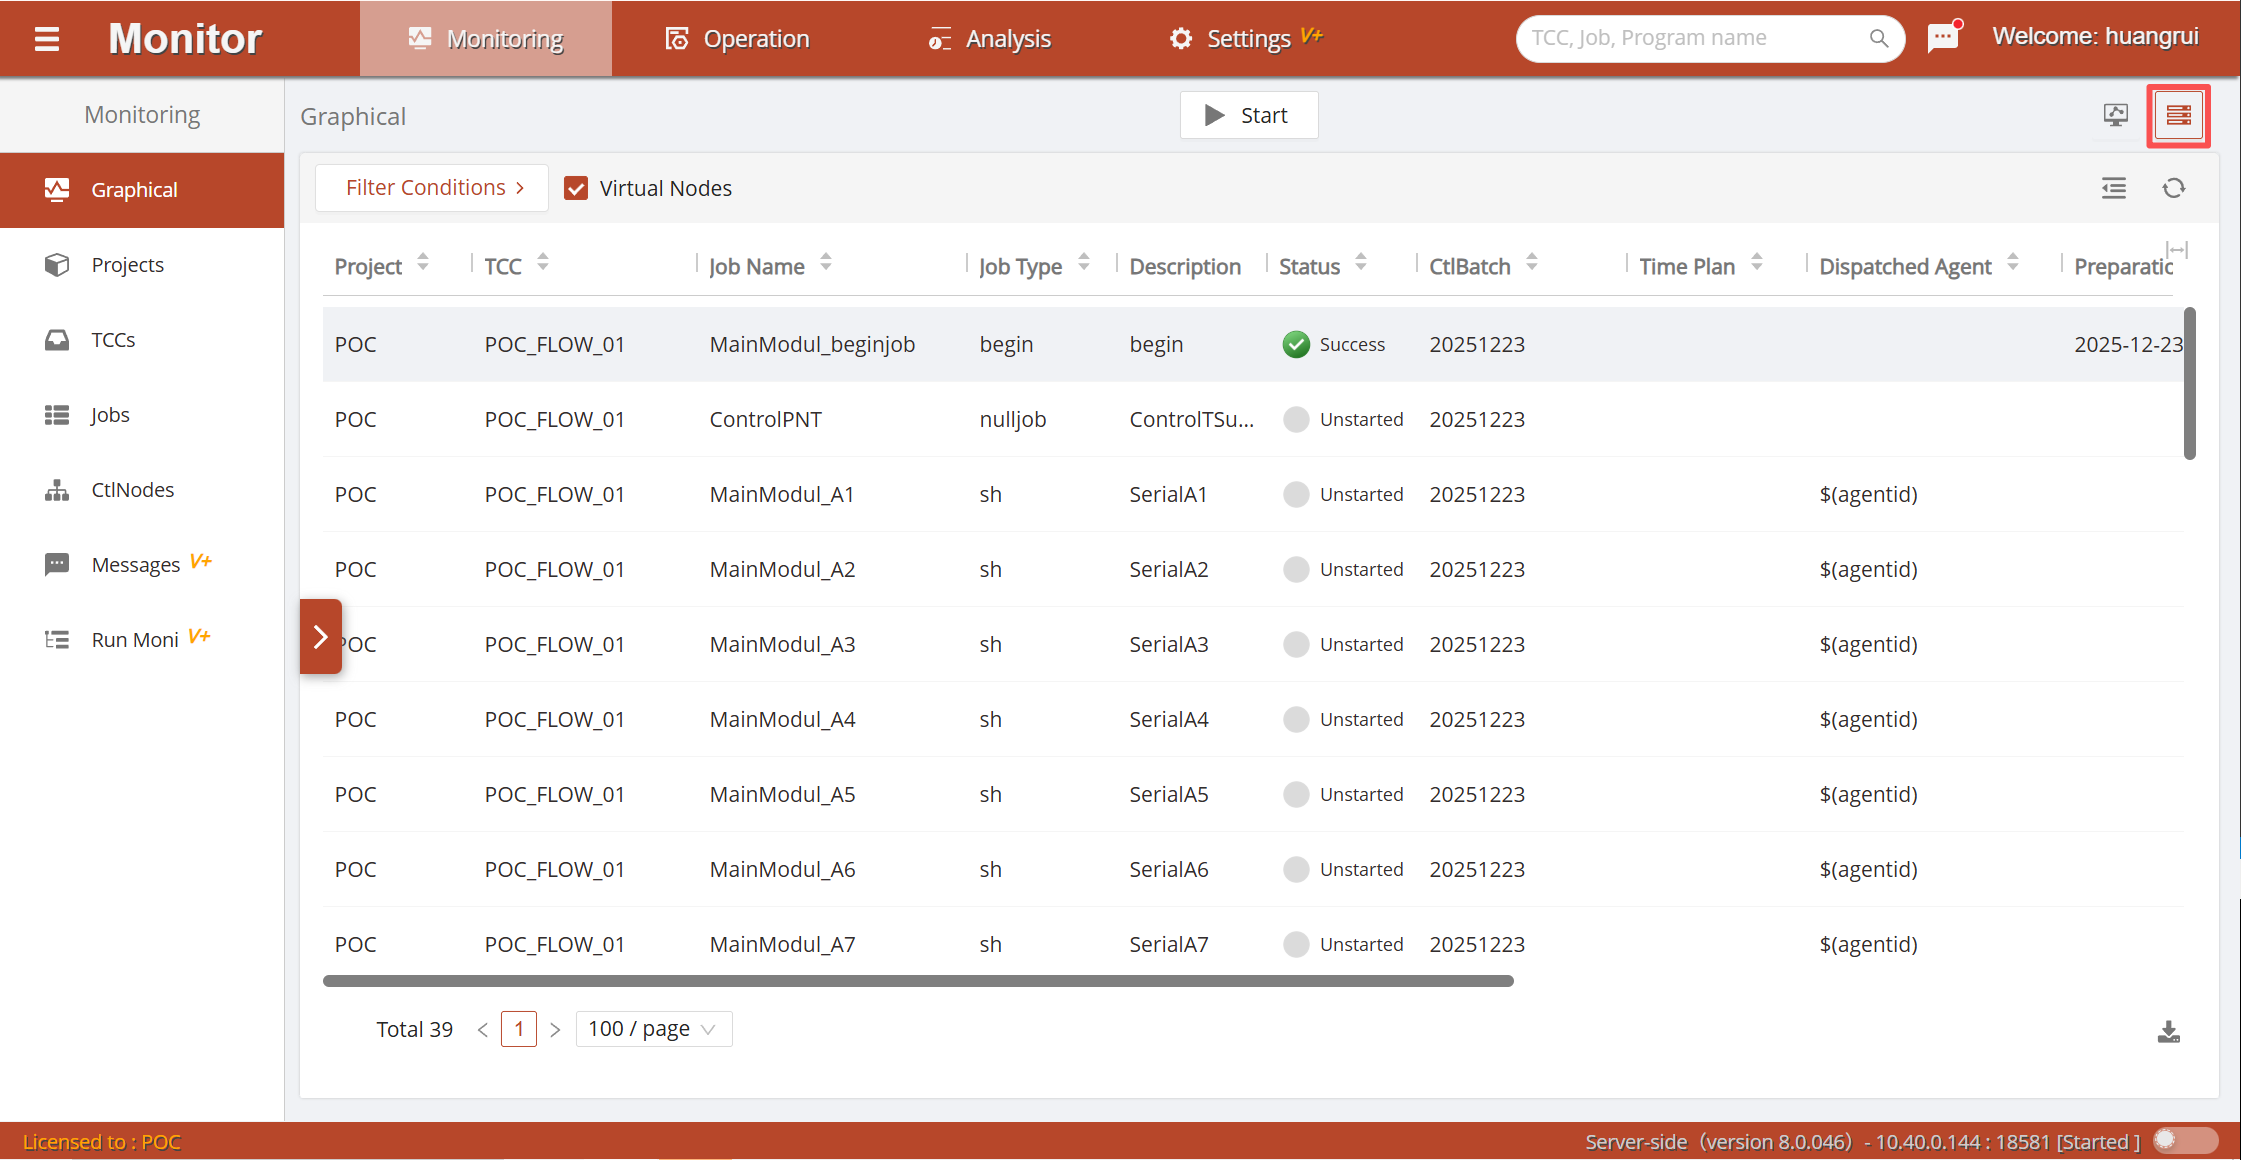
Graph Monitoring
The view area consists of a left-side job container information panel and a right-side job relationship view.
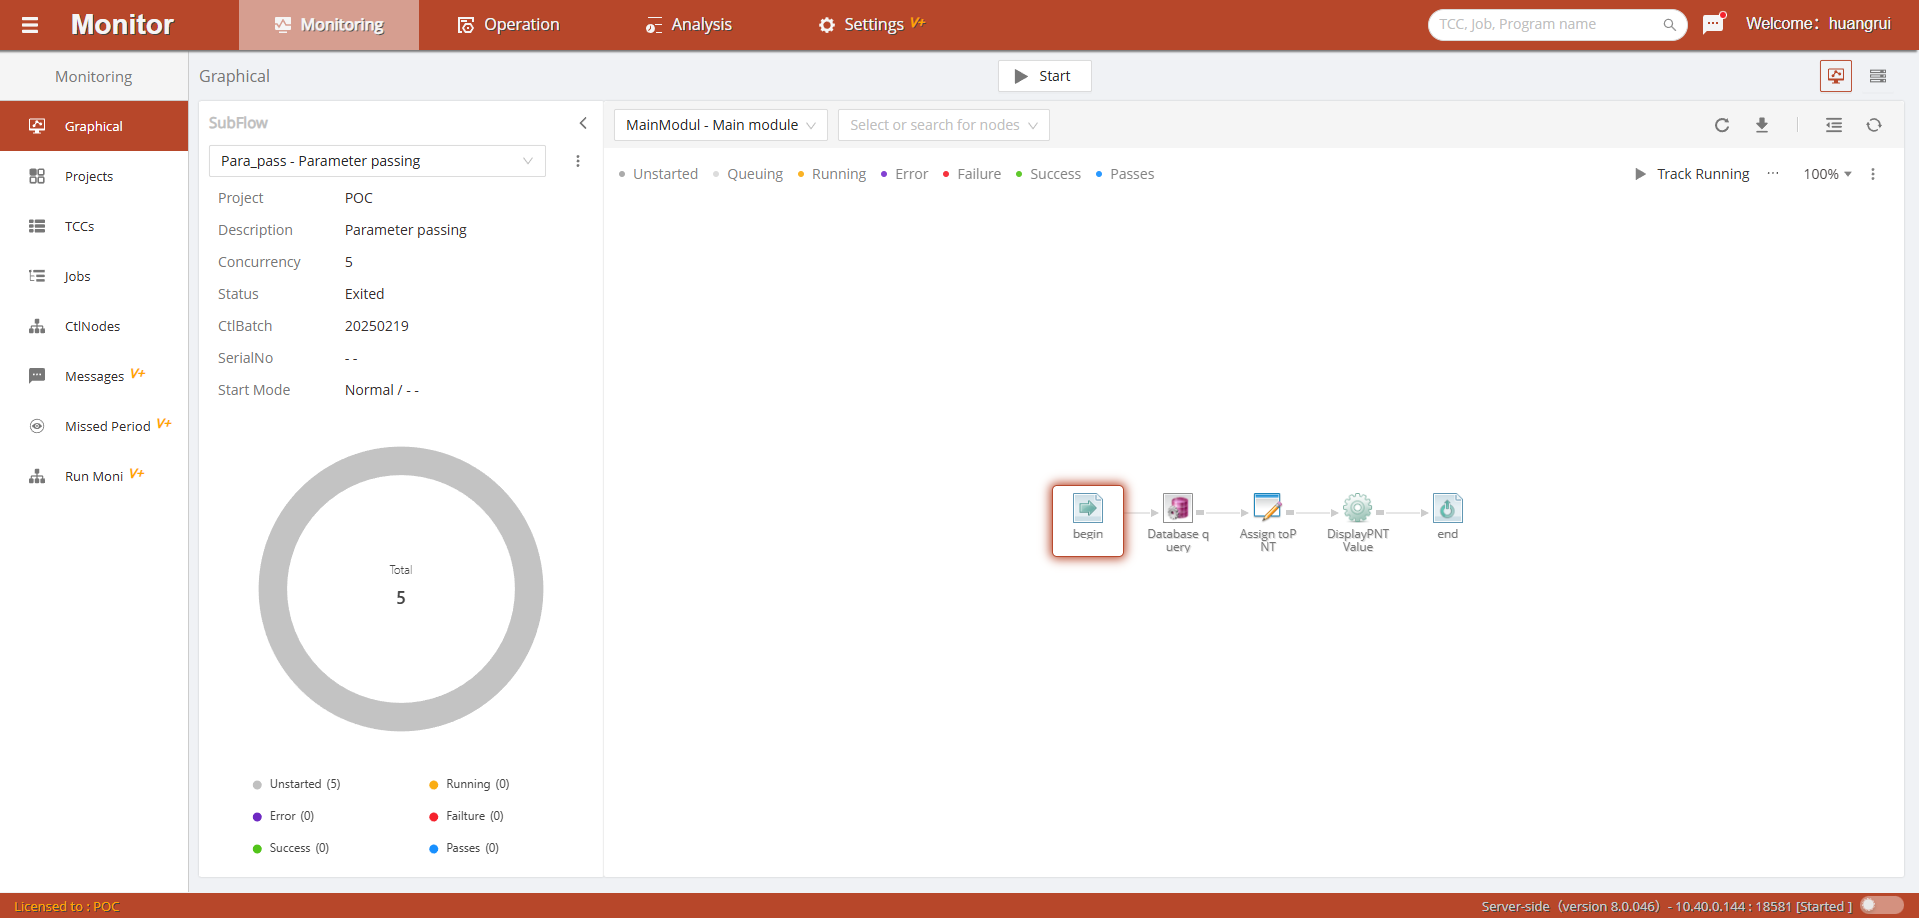
Click the button  on the job container panel to toggle its display state. The job container information panel provides a job container quick-switch selection component and a job container command menu. It also displays the basic information, running information, and status information of the currently selected job container. A donut chart displays the job running status count and proportion statistics.
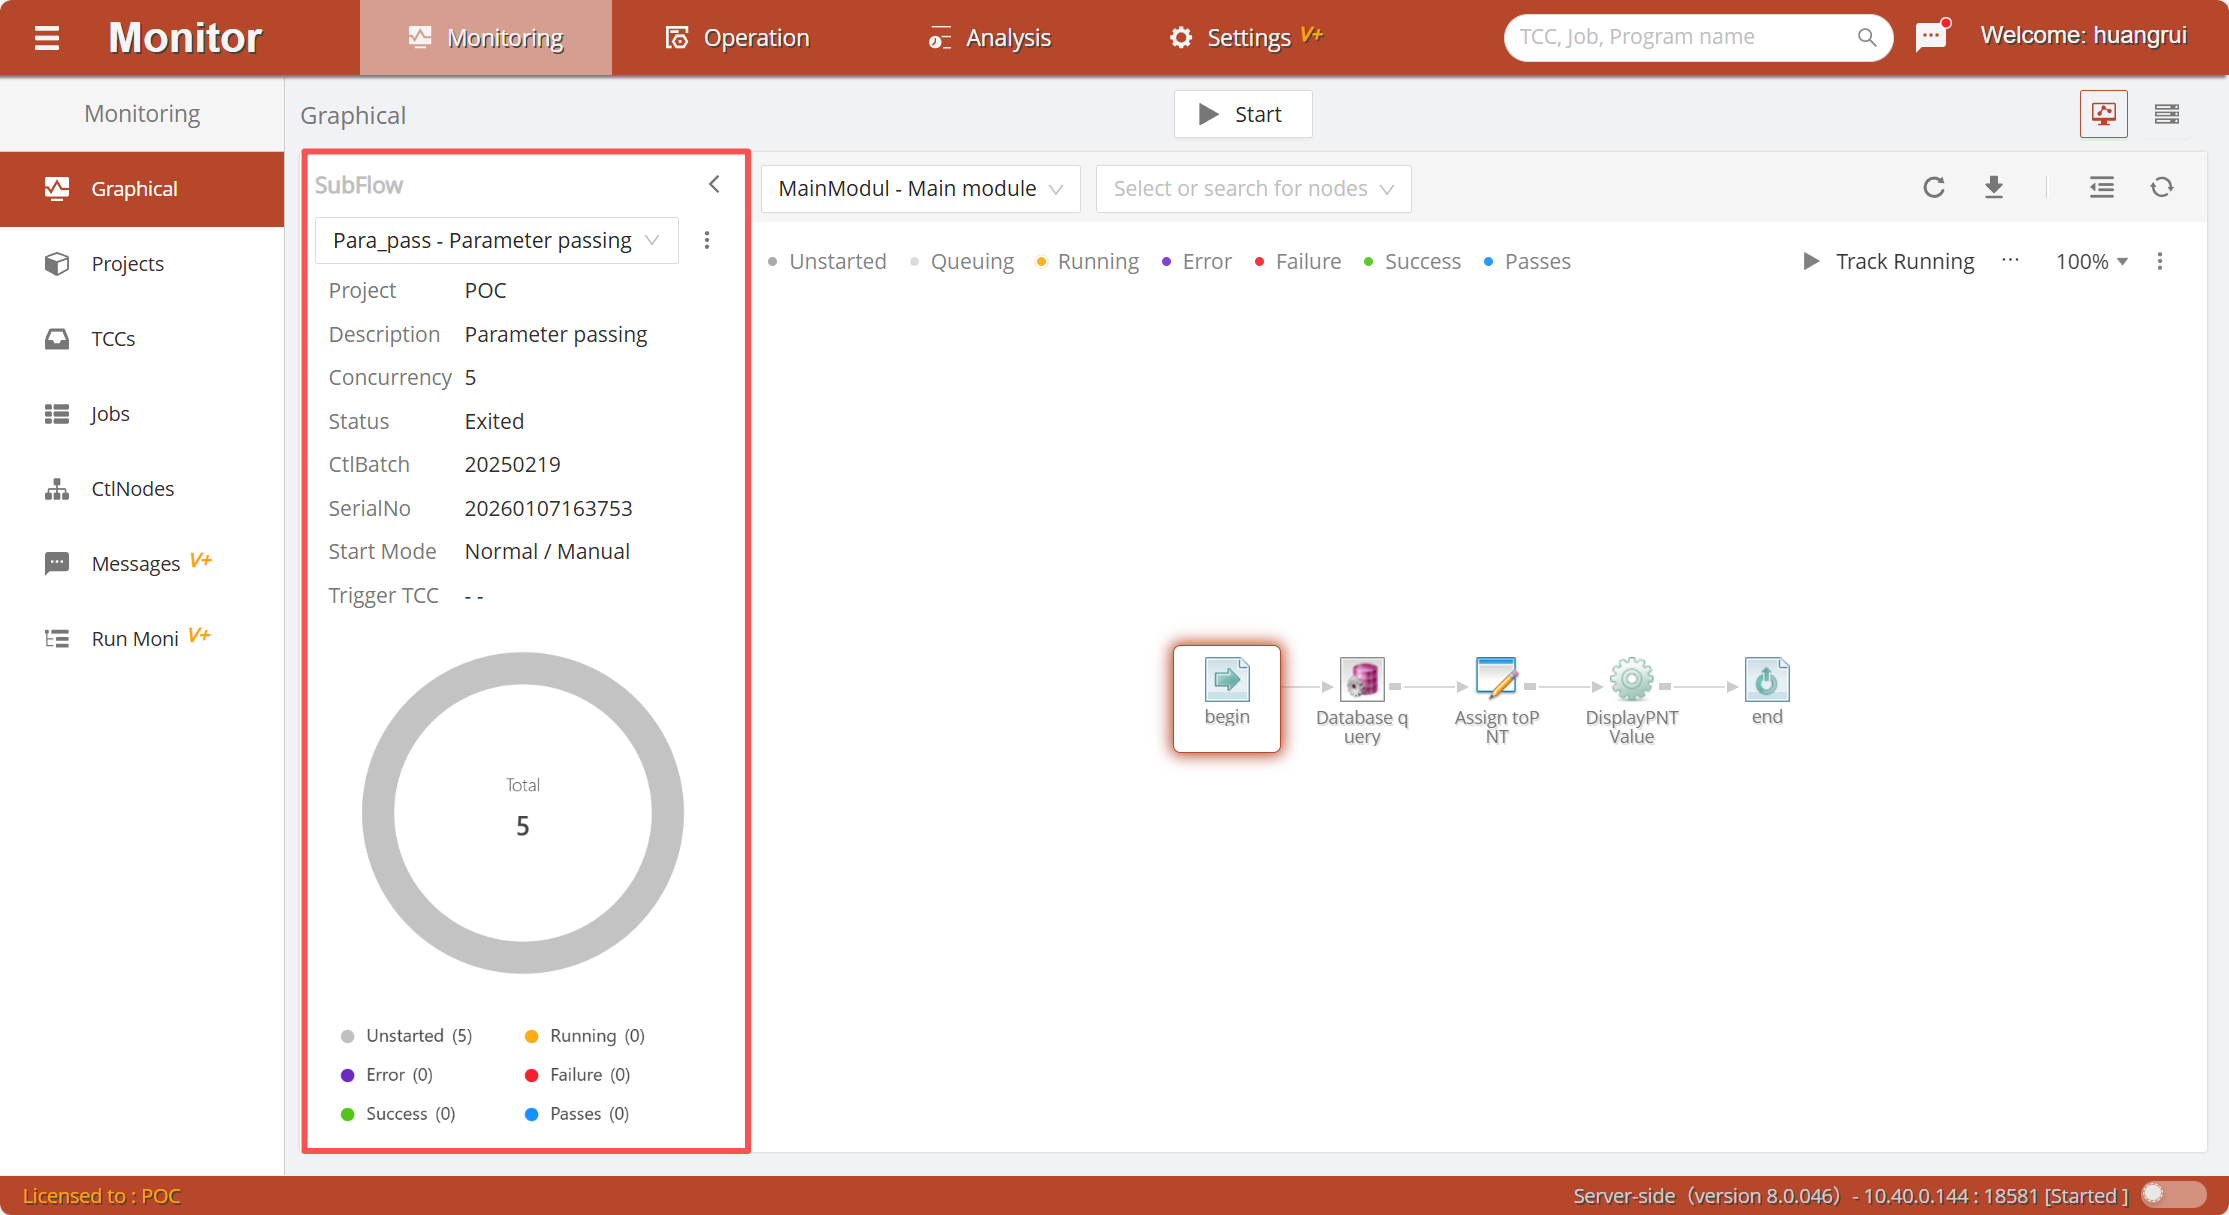
The job relationship view displays the currently selected module view of the job container. You can switch to other module views of the current job container through the module selection component in the toolbar. The main module view is displayed by default.
The job relationship view has two forms, determined by the current job container type. MainFlow and JobFlow use a job flow relationship view from the start node to the end node direction. Timers use a job group relationship view grouped by monitoring labels. As shown in the figures:
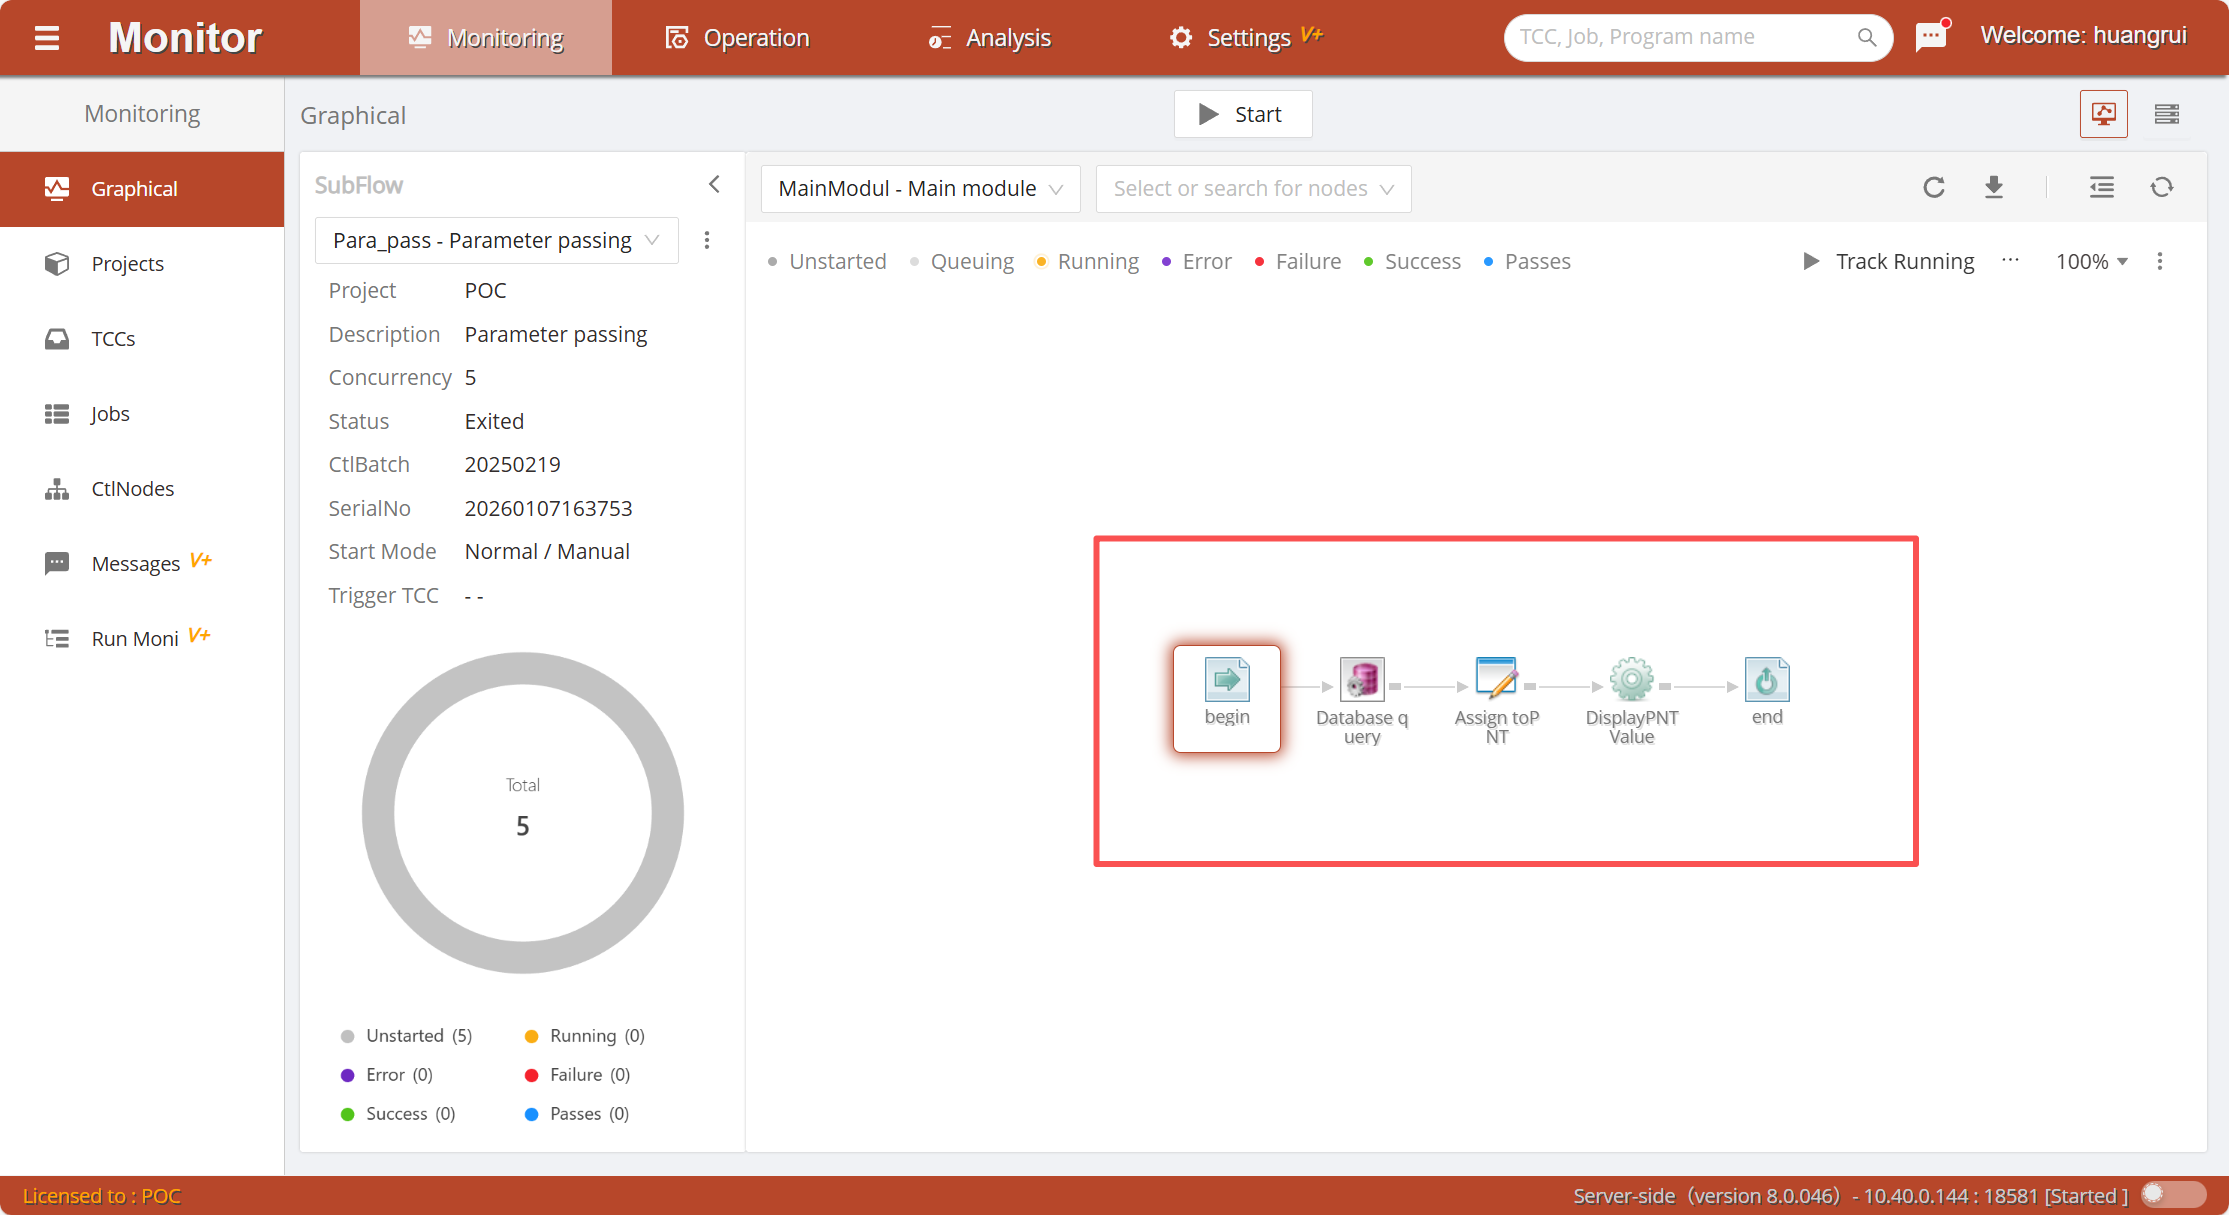
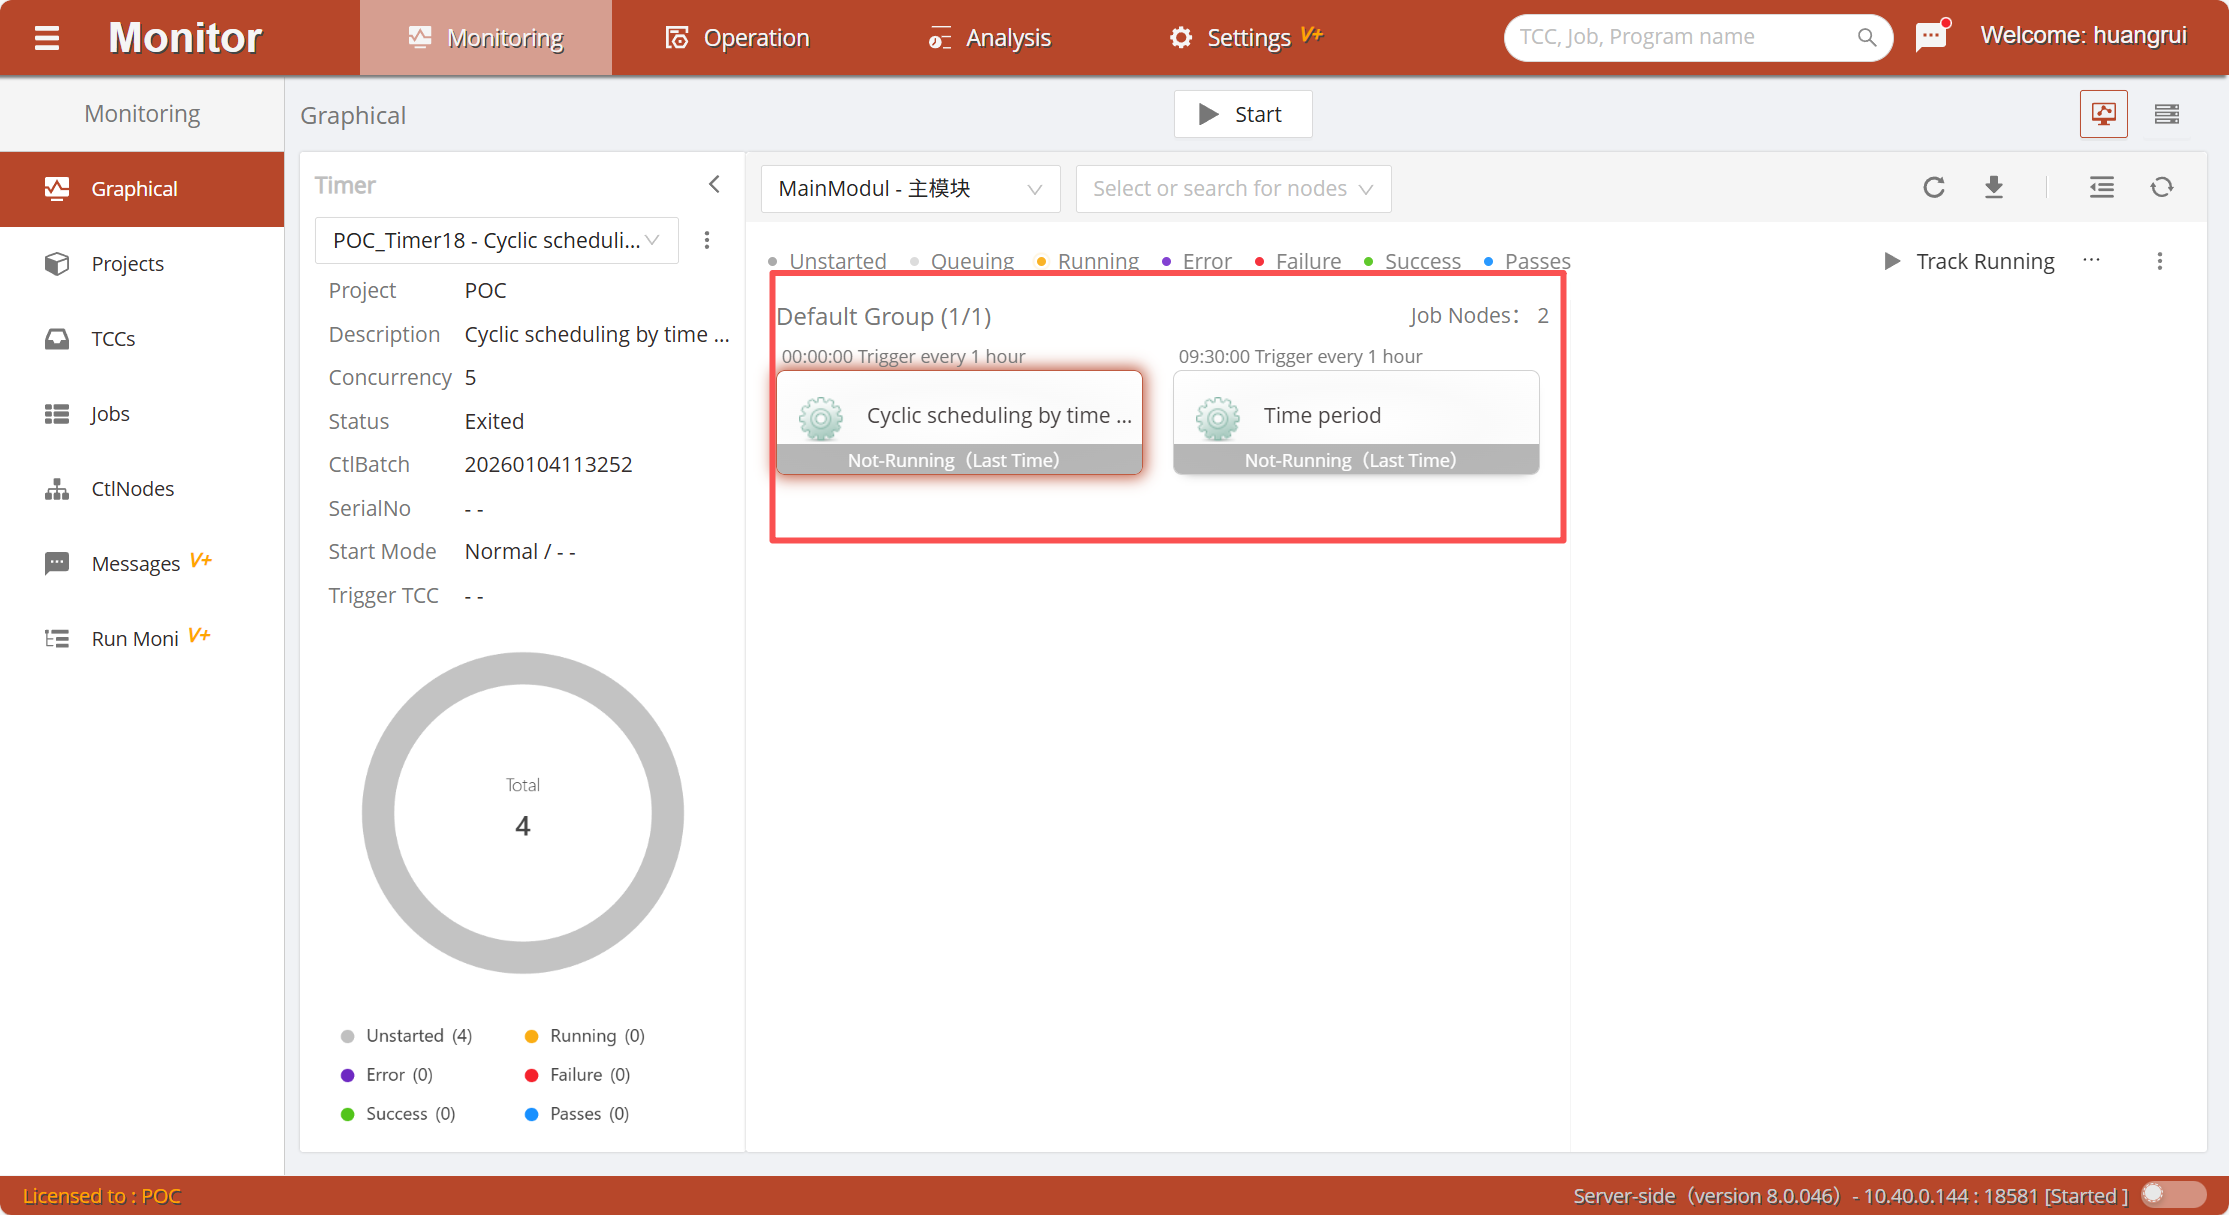
The job flow relationship view displays the job execution sequence flow direction, with the following functional features:
-
Automatic Rule Display: Uses automatic arrangement, so there will be no line crossings in the graph, and the serial and parallel relationships between job nodes are clearly displayed. -
Drill-down Display: Some job containers inevitably have many sub-modules and deep levels. Double-click the include node to drill down into the sub-module. Double-click the flow node to drill down into the referenced subflow. -
Node Name and Description Toggle: Click the extended function button "Show Name/Description" in the view area to quickly switch between technically-named job names and business-described job names. -
Custom Job Icons: Font icons inside node boxes effectively distinguish different job types. For customization of job icons, refer to the Job Types chapter in theWLOADCTL Product Documentation - Admin Management Platform. -
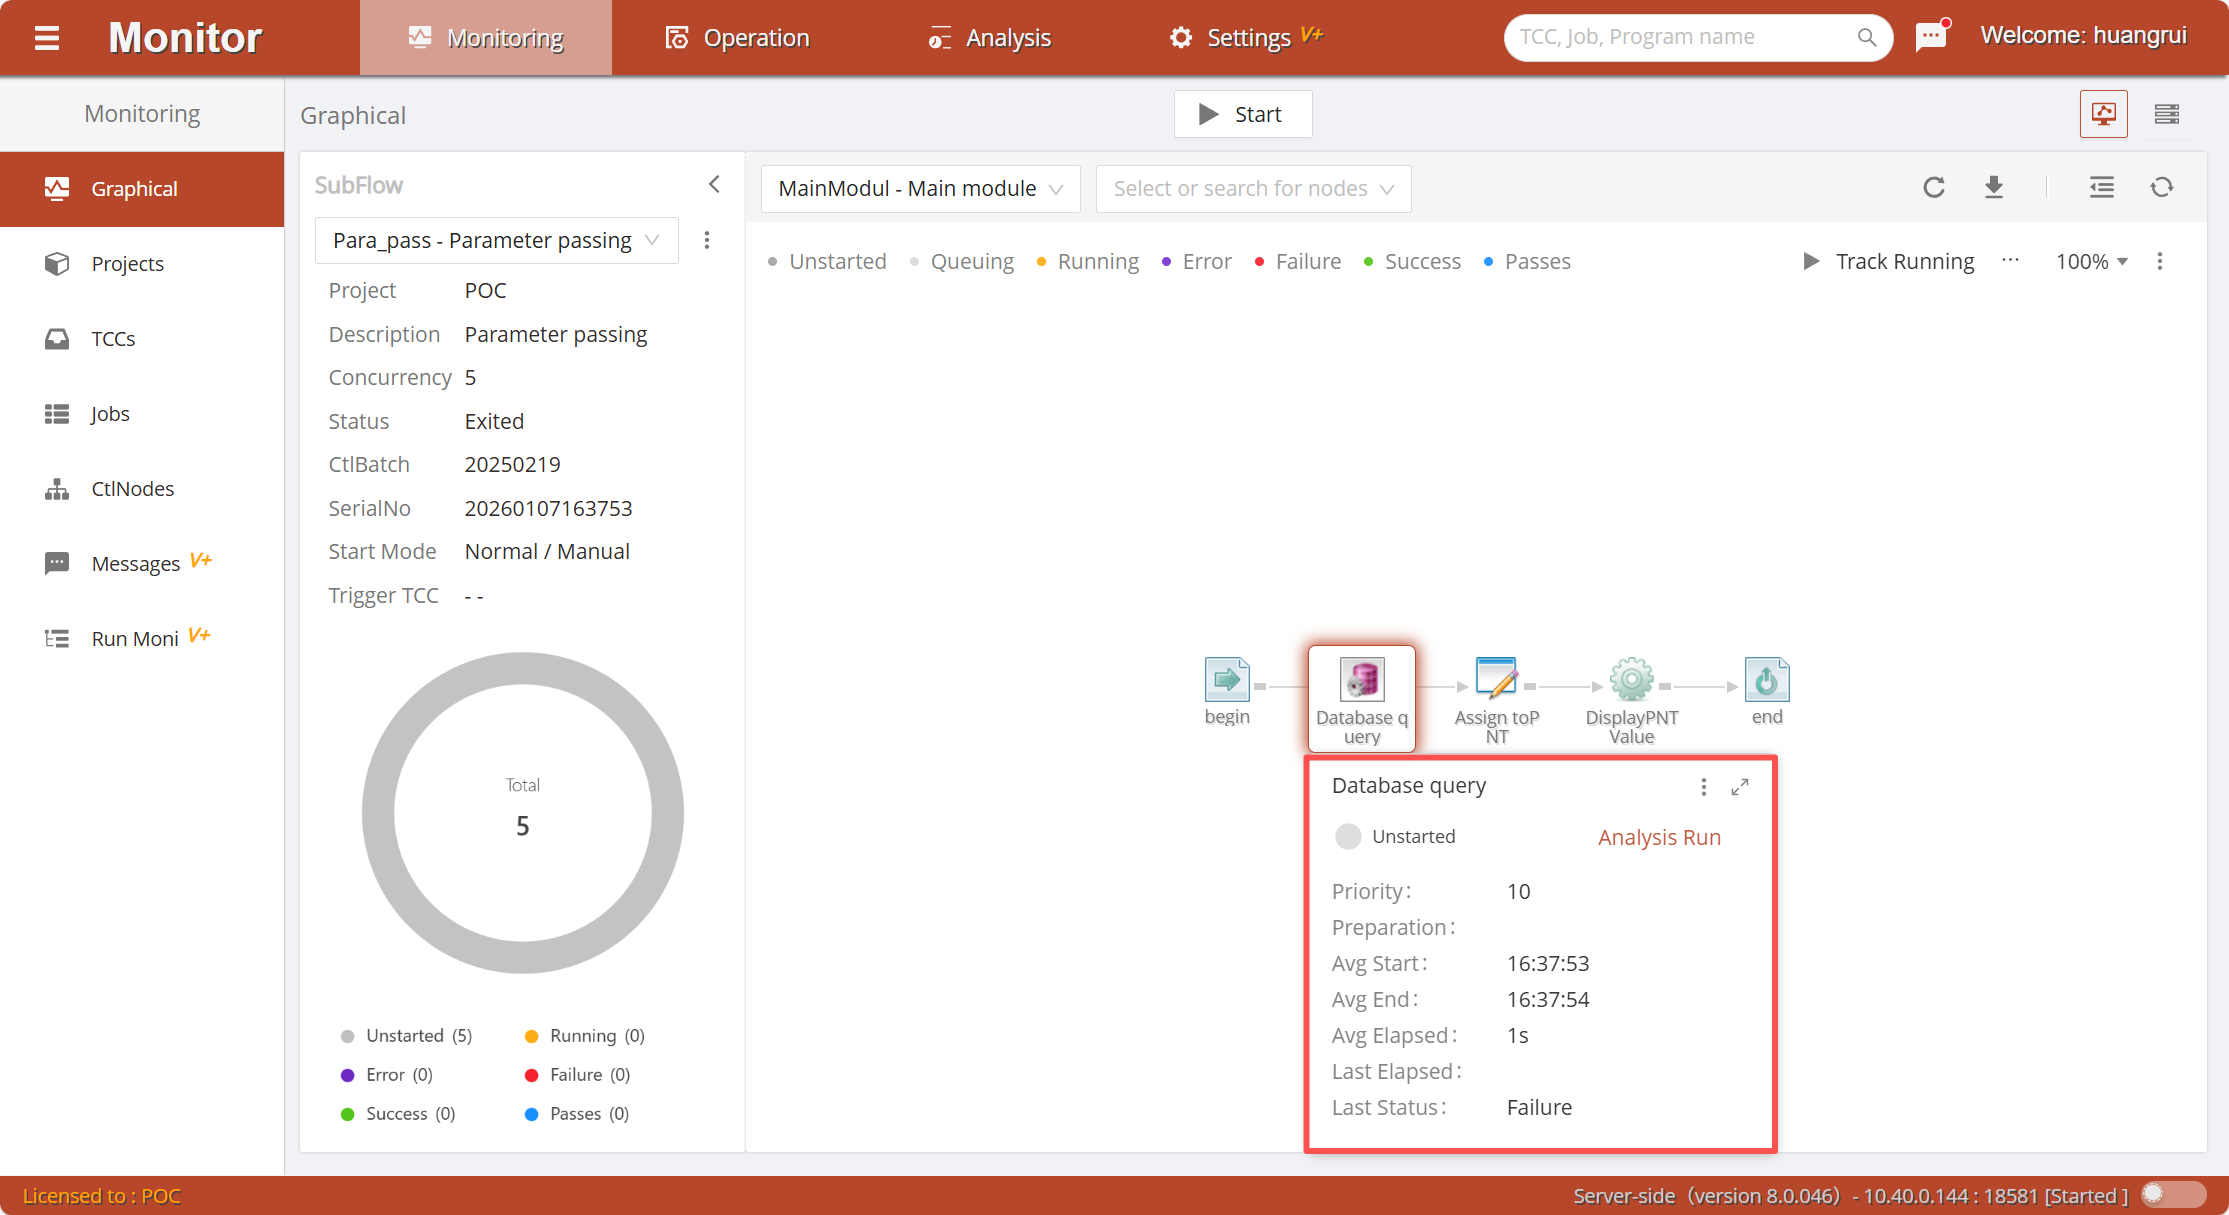
Smart Job Status: The node's running status is displayed by differently colored dots. For different statuses, related information and operations are temporarily displayed intelligently. -
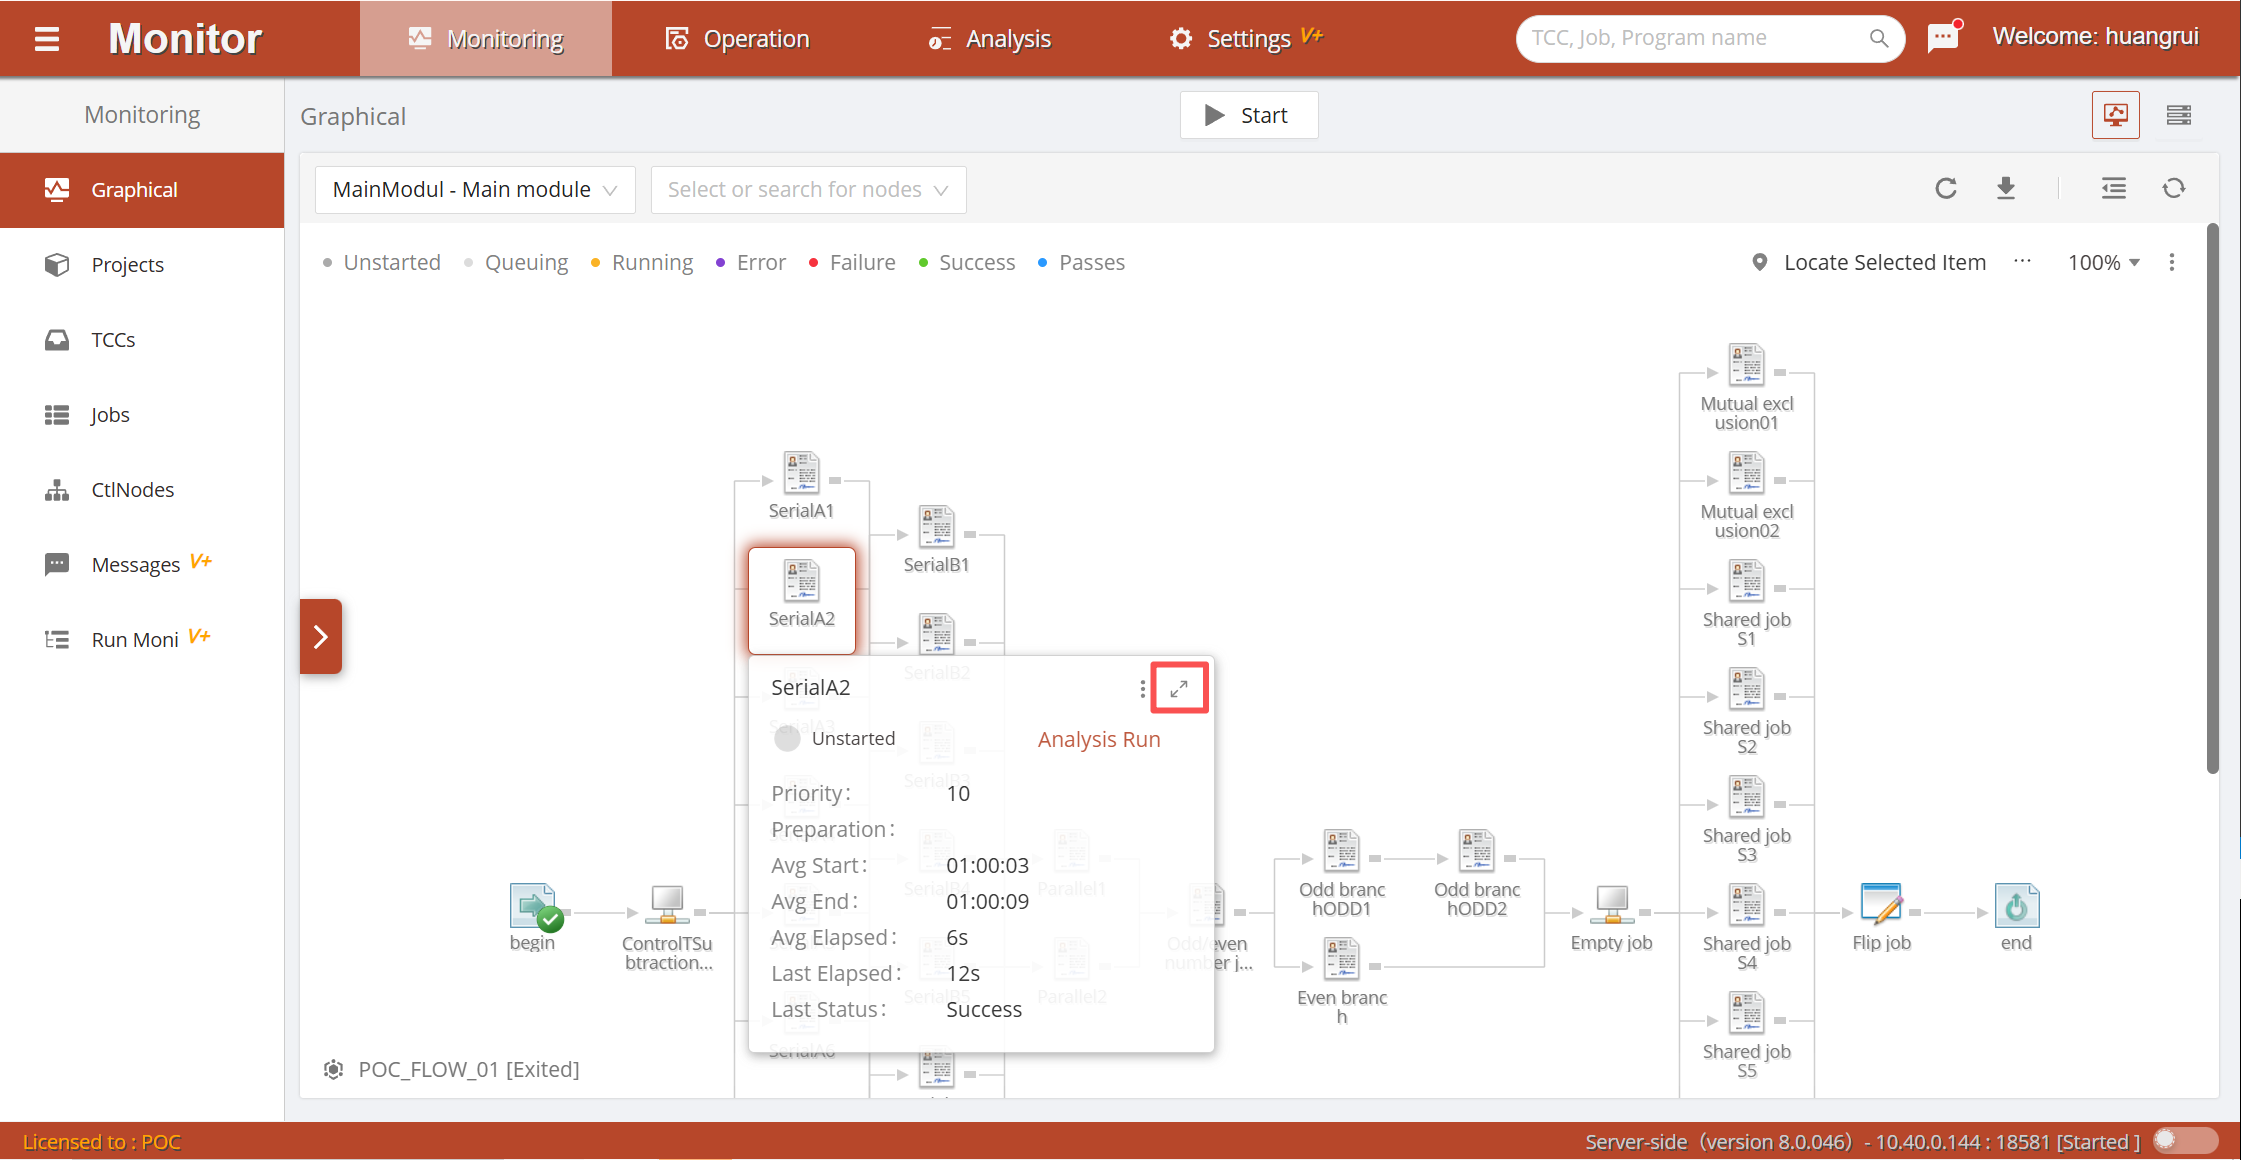
Job Status Quick Panel: Click the node icon to pop up the node status panel, which briefly displays the related operations and related running information of the current job. Click the extended button to quickly pop up the command menu. Click the button to further expand the job detailed attributes.
-
Graph Node Search and Positioning: Enter a node name keyword (case-insensitive fuzzy matching supported) in the toolbar's "Job Node Search Box" to pop up a list of matching nodes. Click the list item to automatically position to the job node location.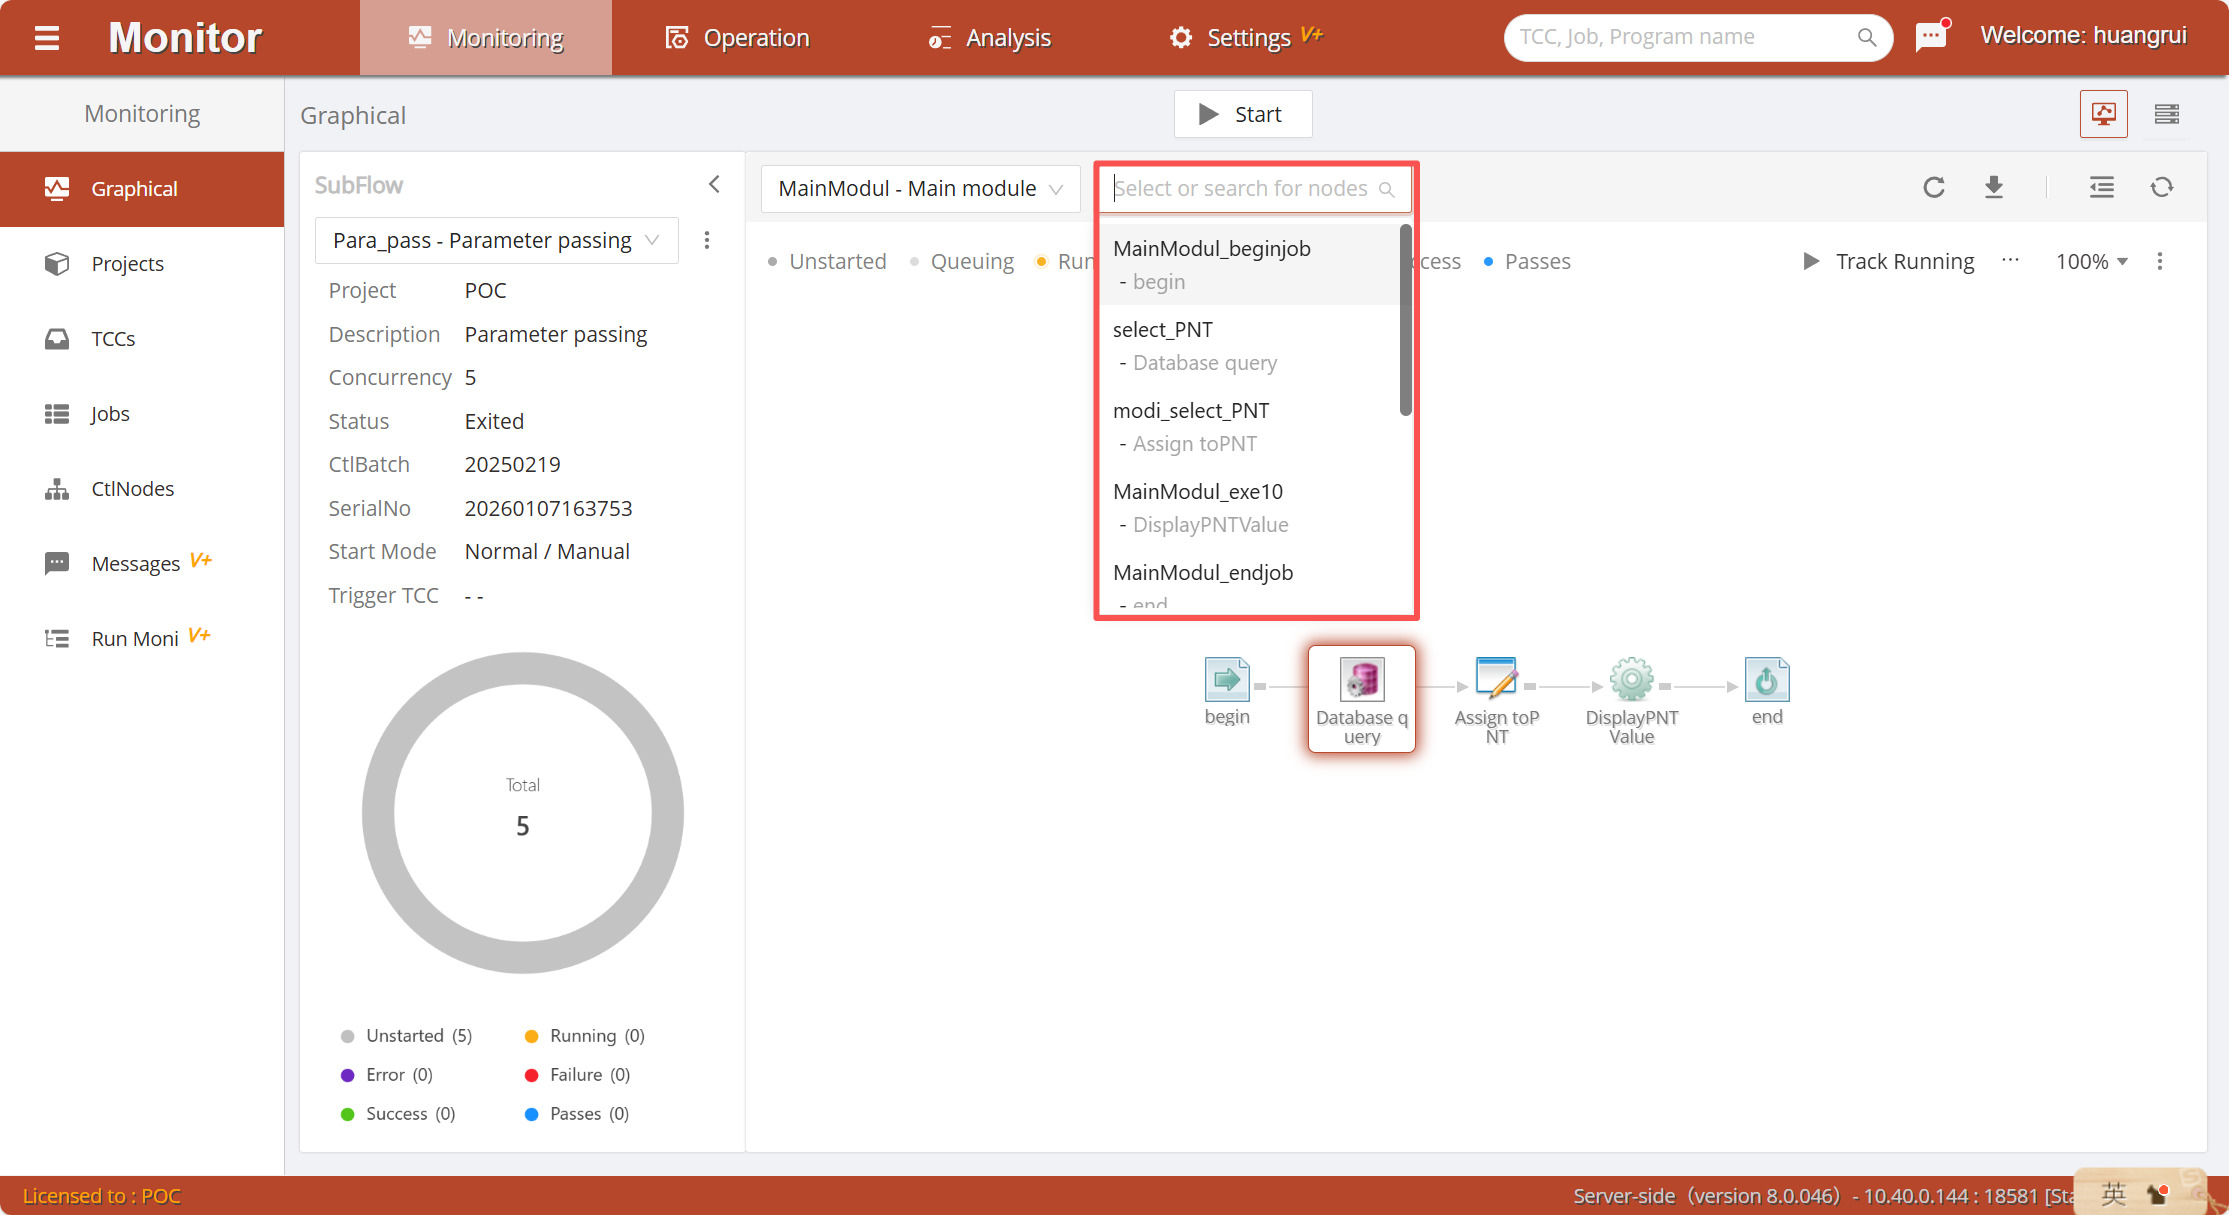
-
Quick Positioning for Currently Executing Job Nodes: During the running of a job container, the most关注的 jobs are usually those that are currently executing and abnormal. However, the status of job nodes keeps changing, and if the page is not viewed for a long time, monitoring focus will be lost. Click the button in the upper-right corner of the view area to automatically position to jobs that are currently executing and abnormal.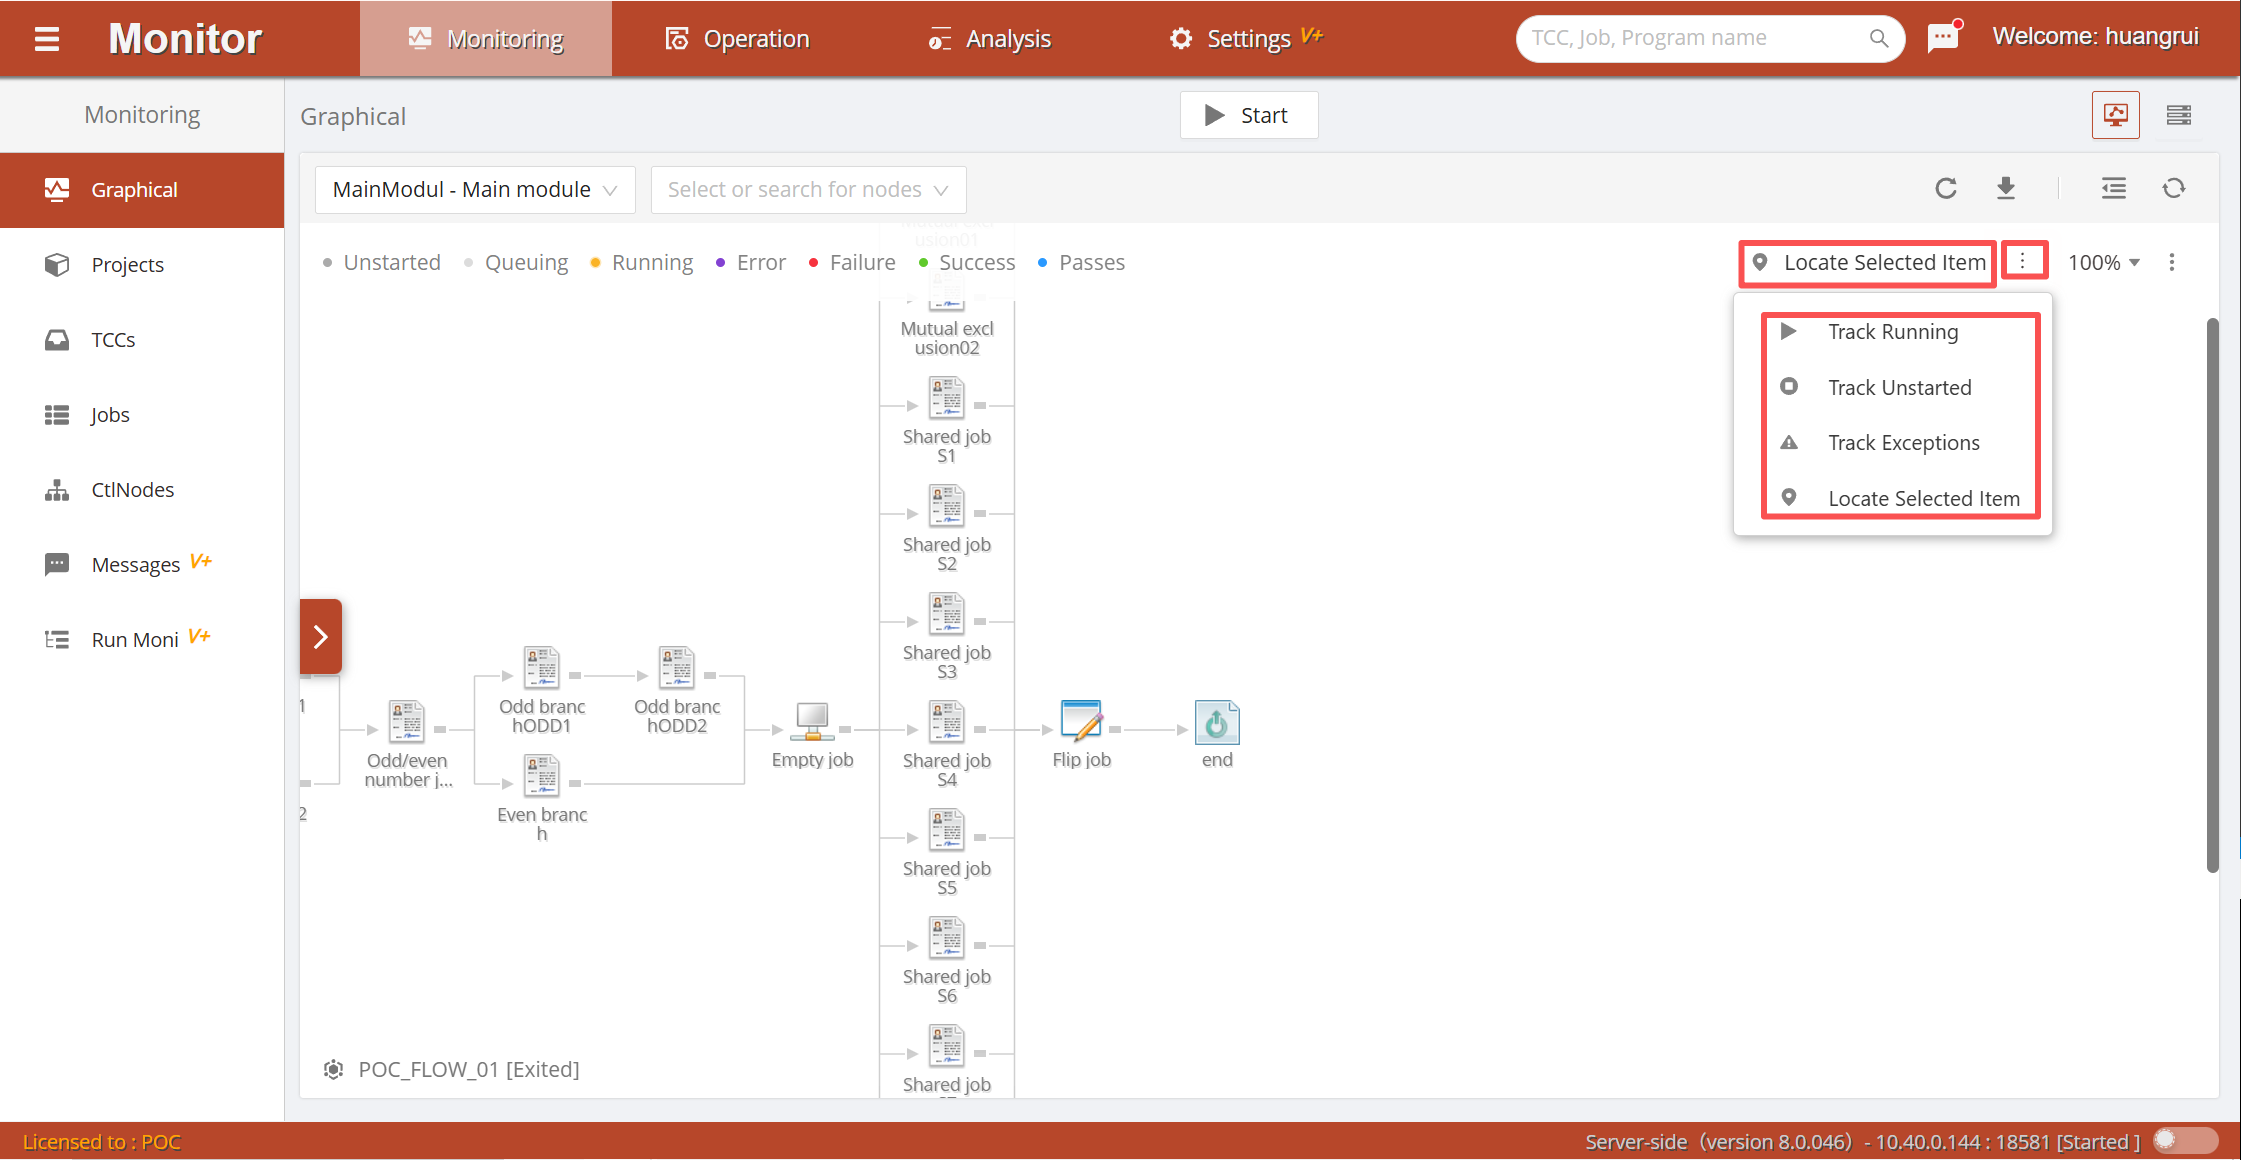
-
Graph Zoom: Facing workflows composed of many jobs, the page cannot fully display all job relationships. Click the button to zoom out the graph proportion. You can monitor more job relationships and running status.
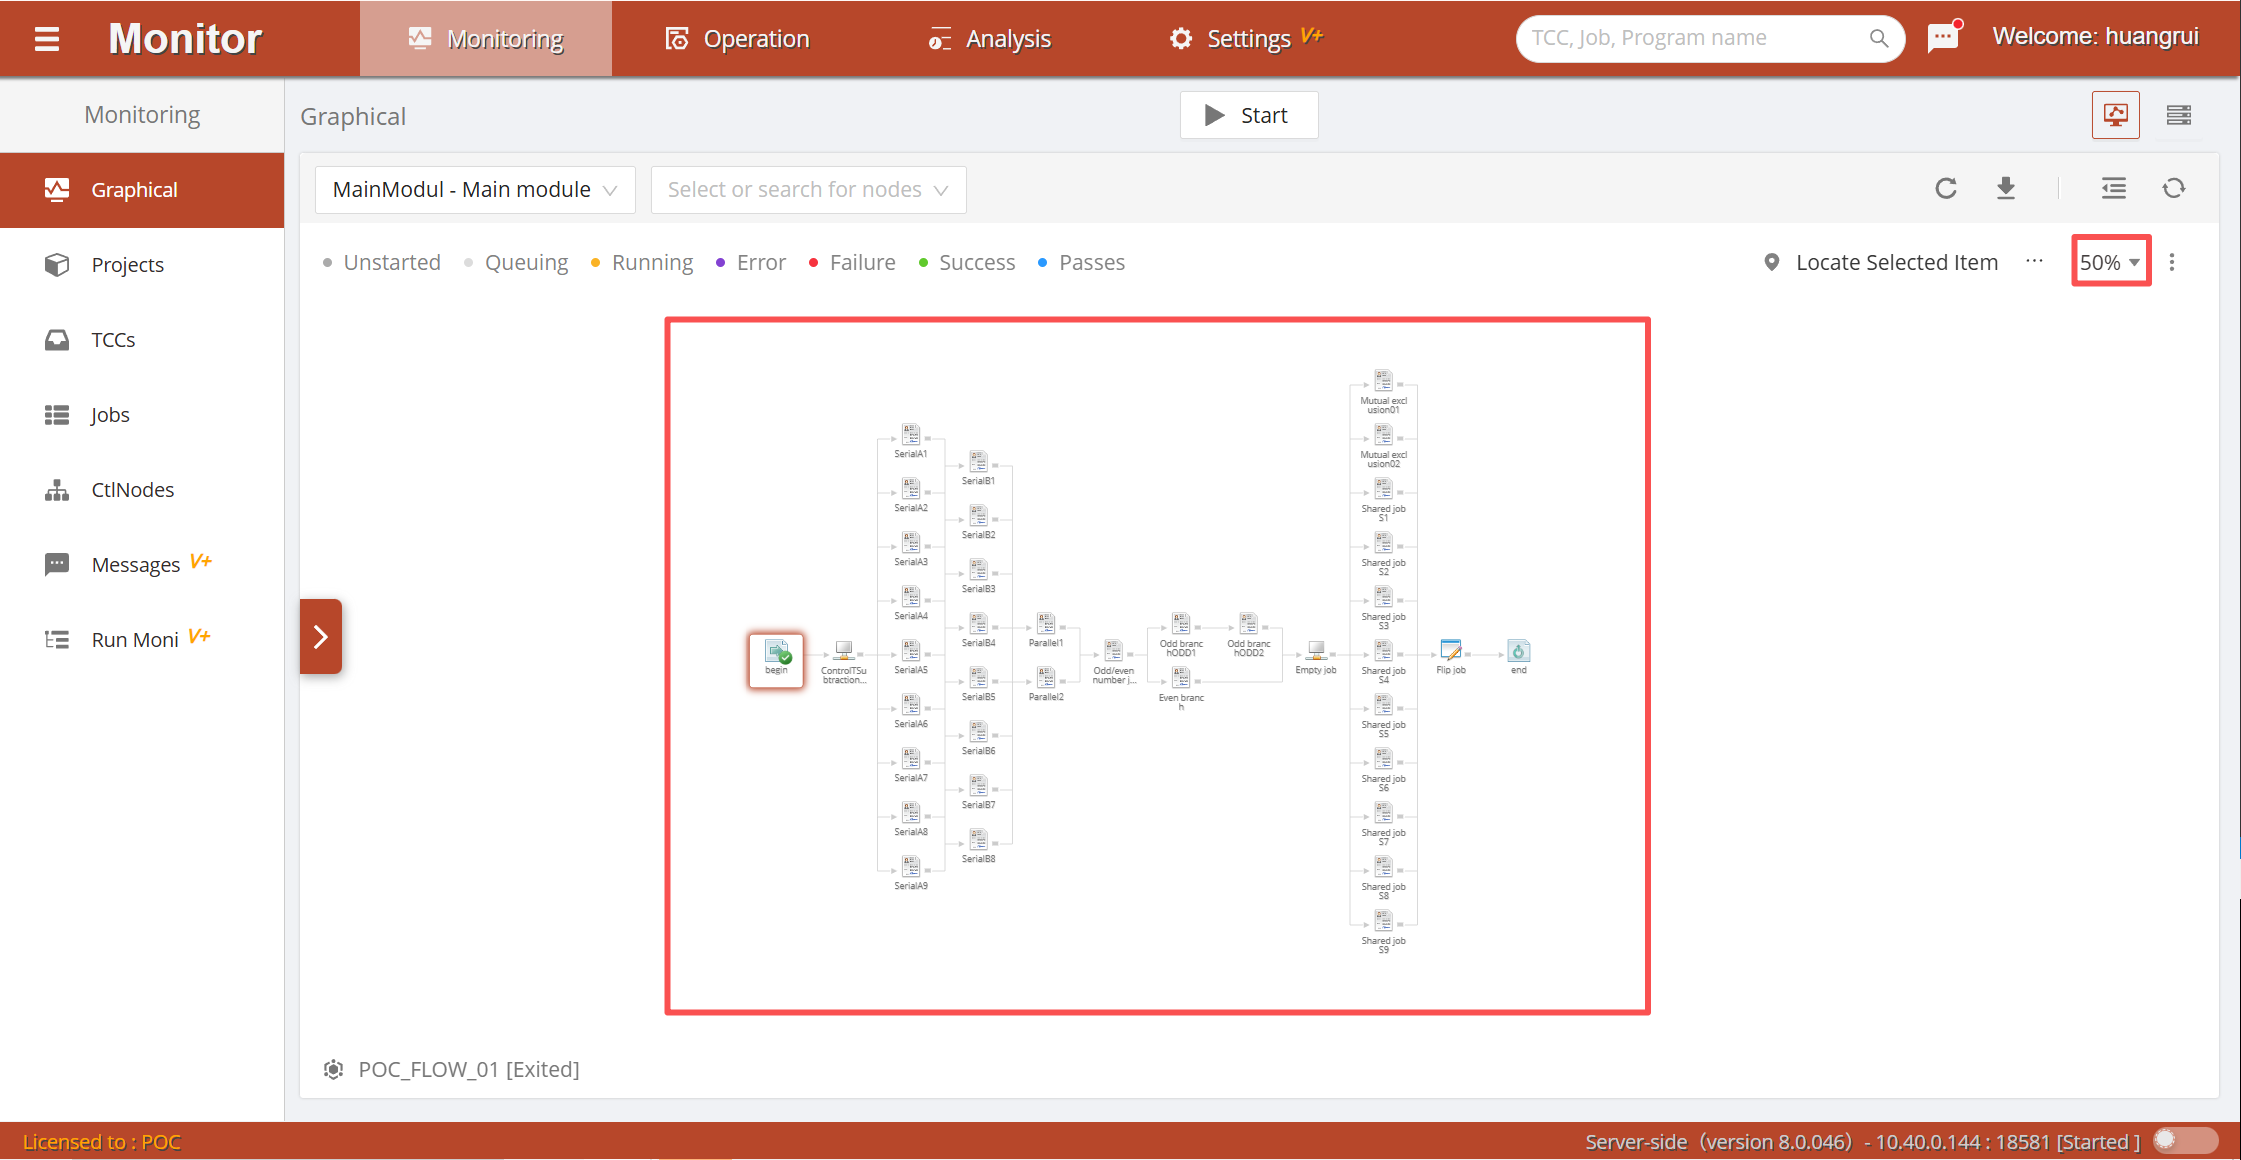
The functional features of the job group relationship view are similar to those of the job flow relationship view, using grouping to distinguish jobs with different business or technical characteristics. According to the technical characteristics of scheduled jobs, the scheduled frequency is displayed in the upper-left corner of the node, and the bottom color block displays different information based on the job's running status, such as: last run status, current run status, abnormal status, and next run estimated time, etc.
Start Job Container
When the job container is not running, click the Exited button in the upper-middle of the page to open the start container dialog.
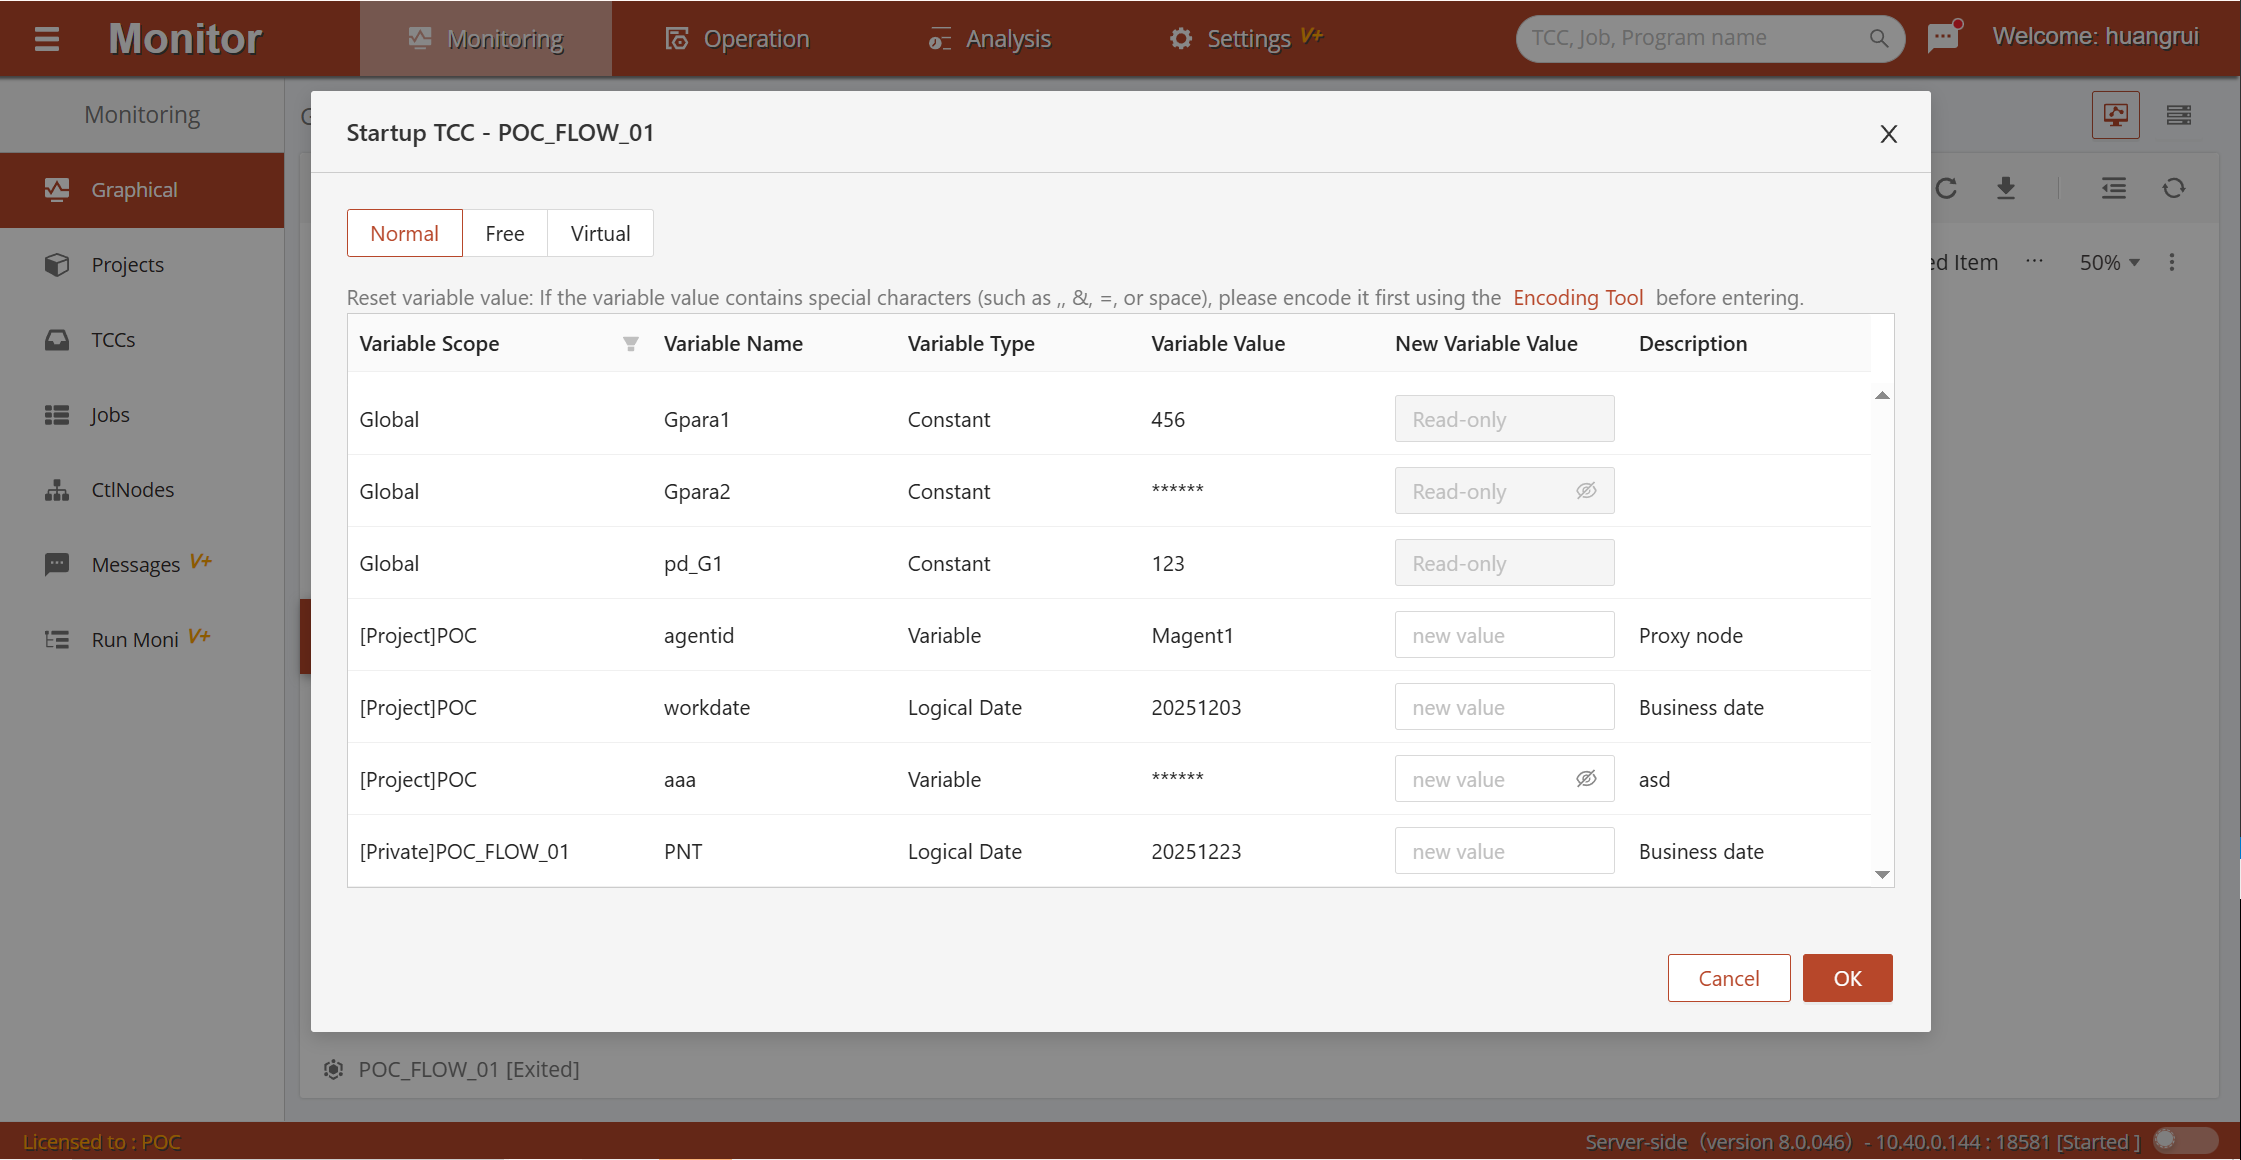
Select Startup Mode
Normal Mode: A job container started in normal mode runs the workflow from the start node to the end node.
Free Mode: A job container started in free mode requires further selection of any node or branch of the workflow to run.
Virtual Mode: A job container started in virtual mode does not actually run jobs, only simulates the running situation. You can select the virtual running speed multiplier.
Note: Timers only support normal mode.
Reset Variable Values
Reset the project variables and private variables for the job container about to start. Platform variables cannot have their runtime values changed.
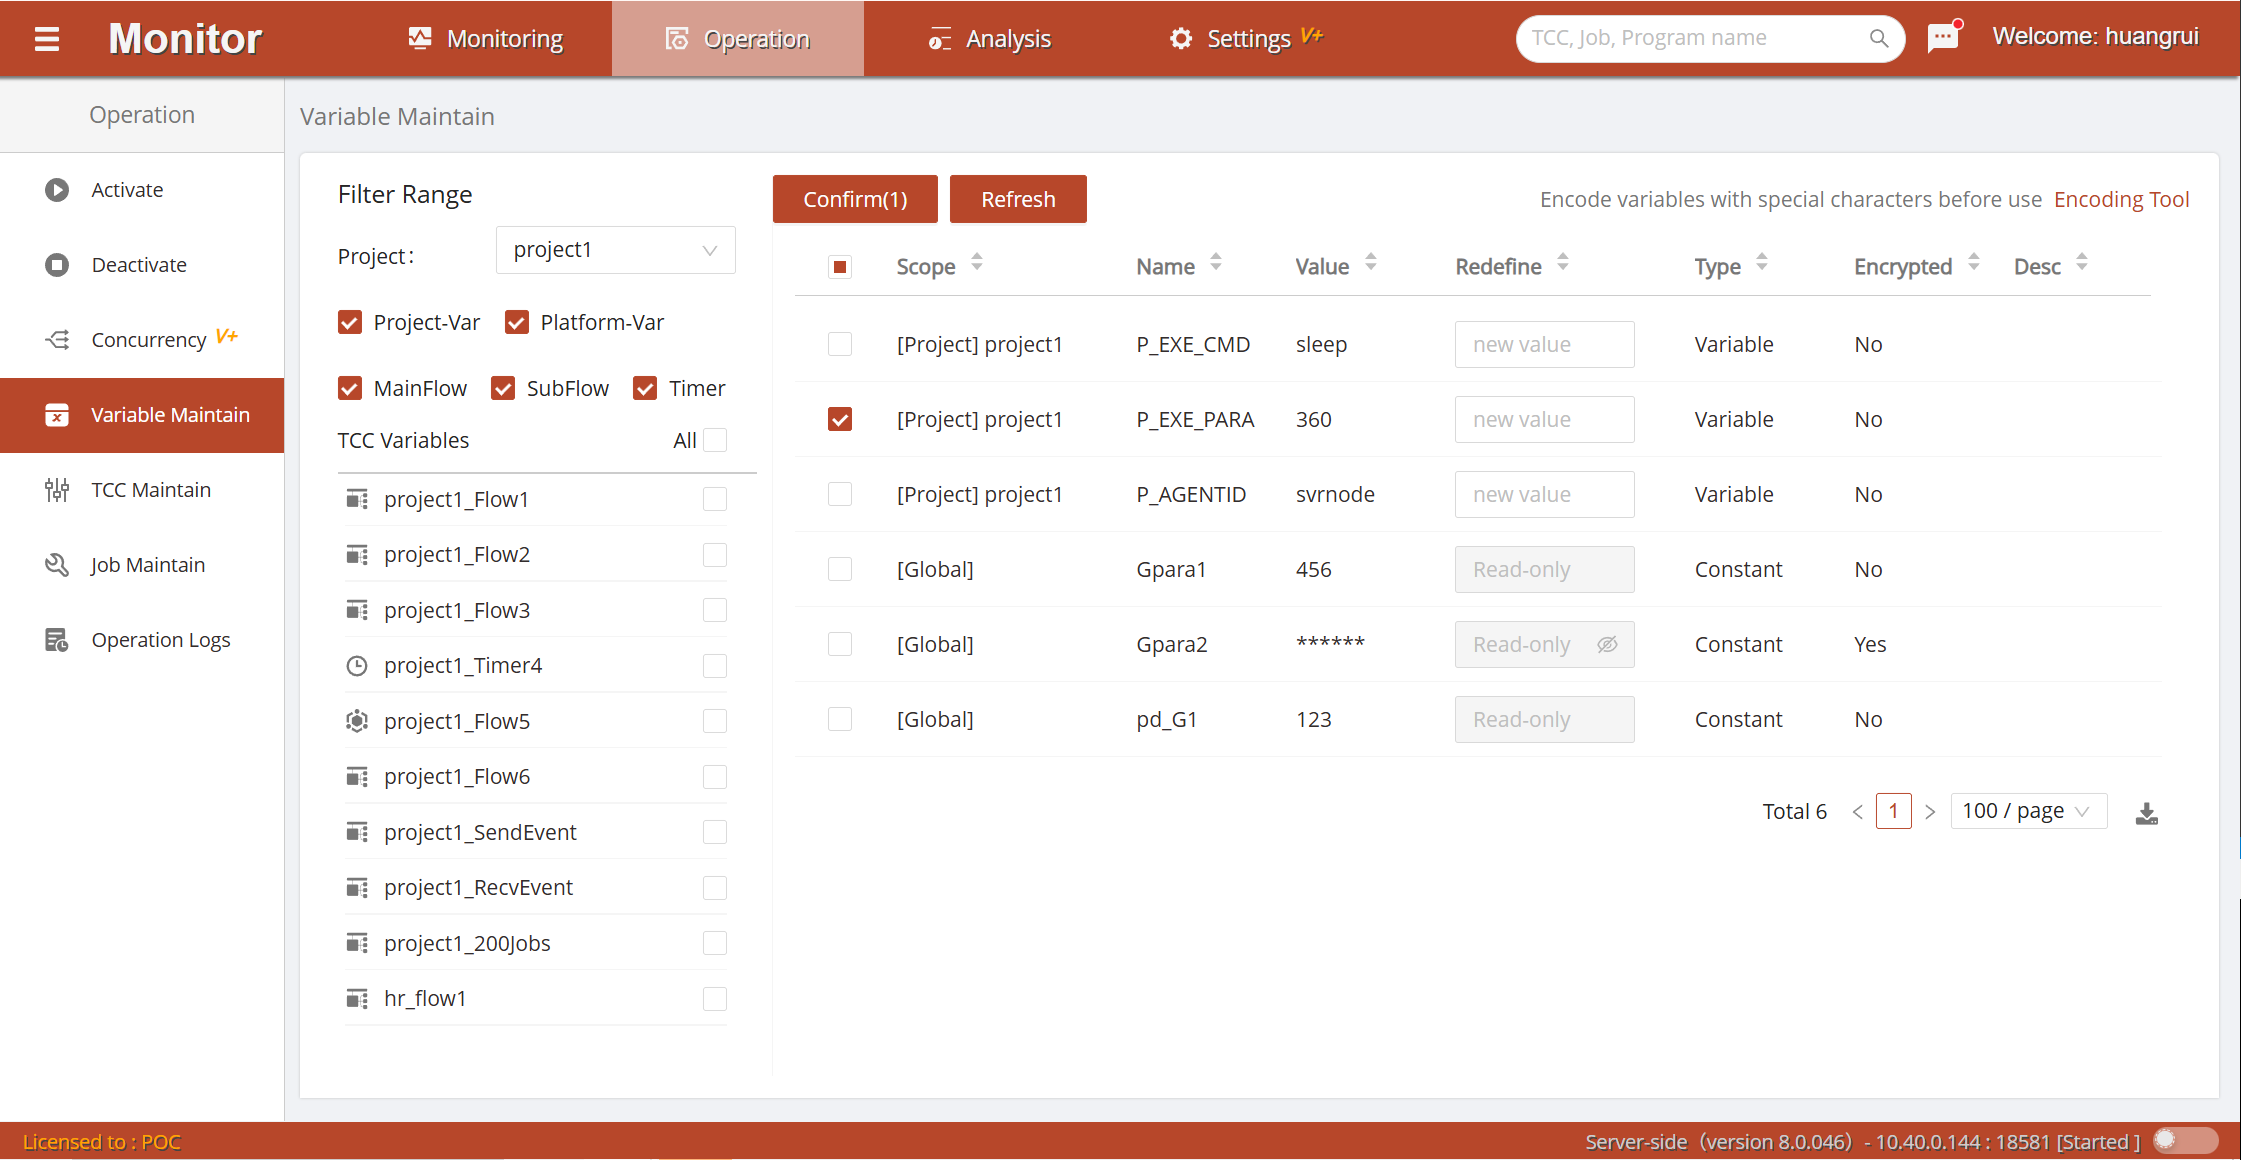
Click confirm, and the job container starts running.
Reset Job Container
When the job container is stopped, click the  button in the toolbar to execute the reset operation, setting the running status of all nodes within the job container to the initialized state.
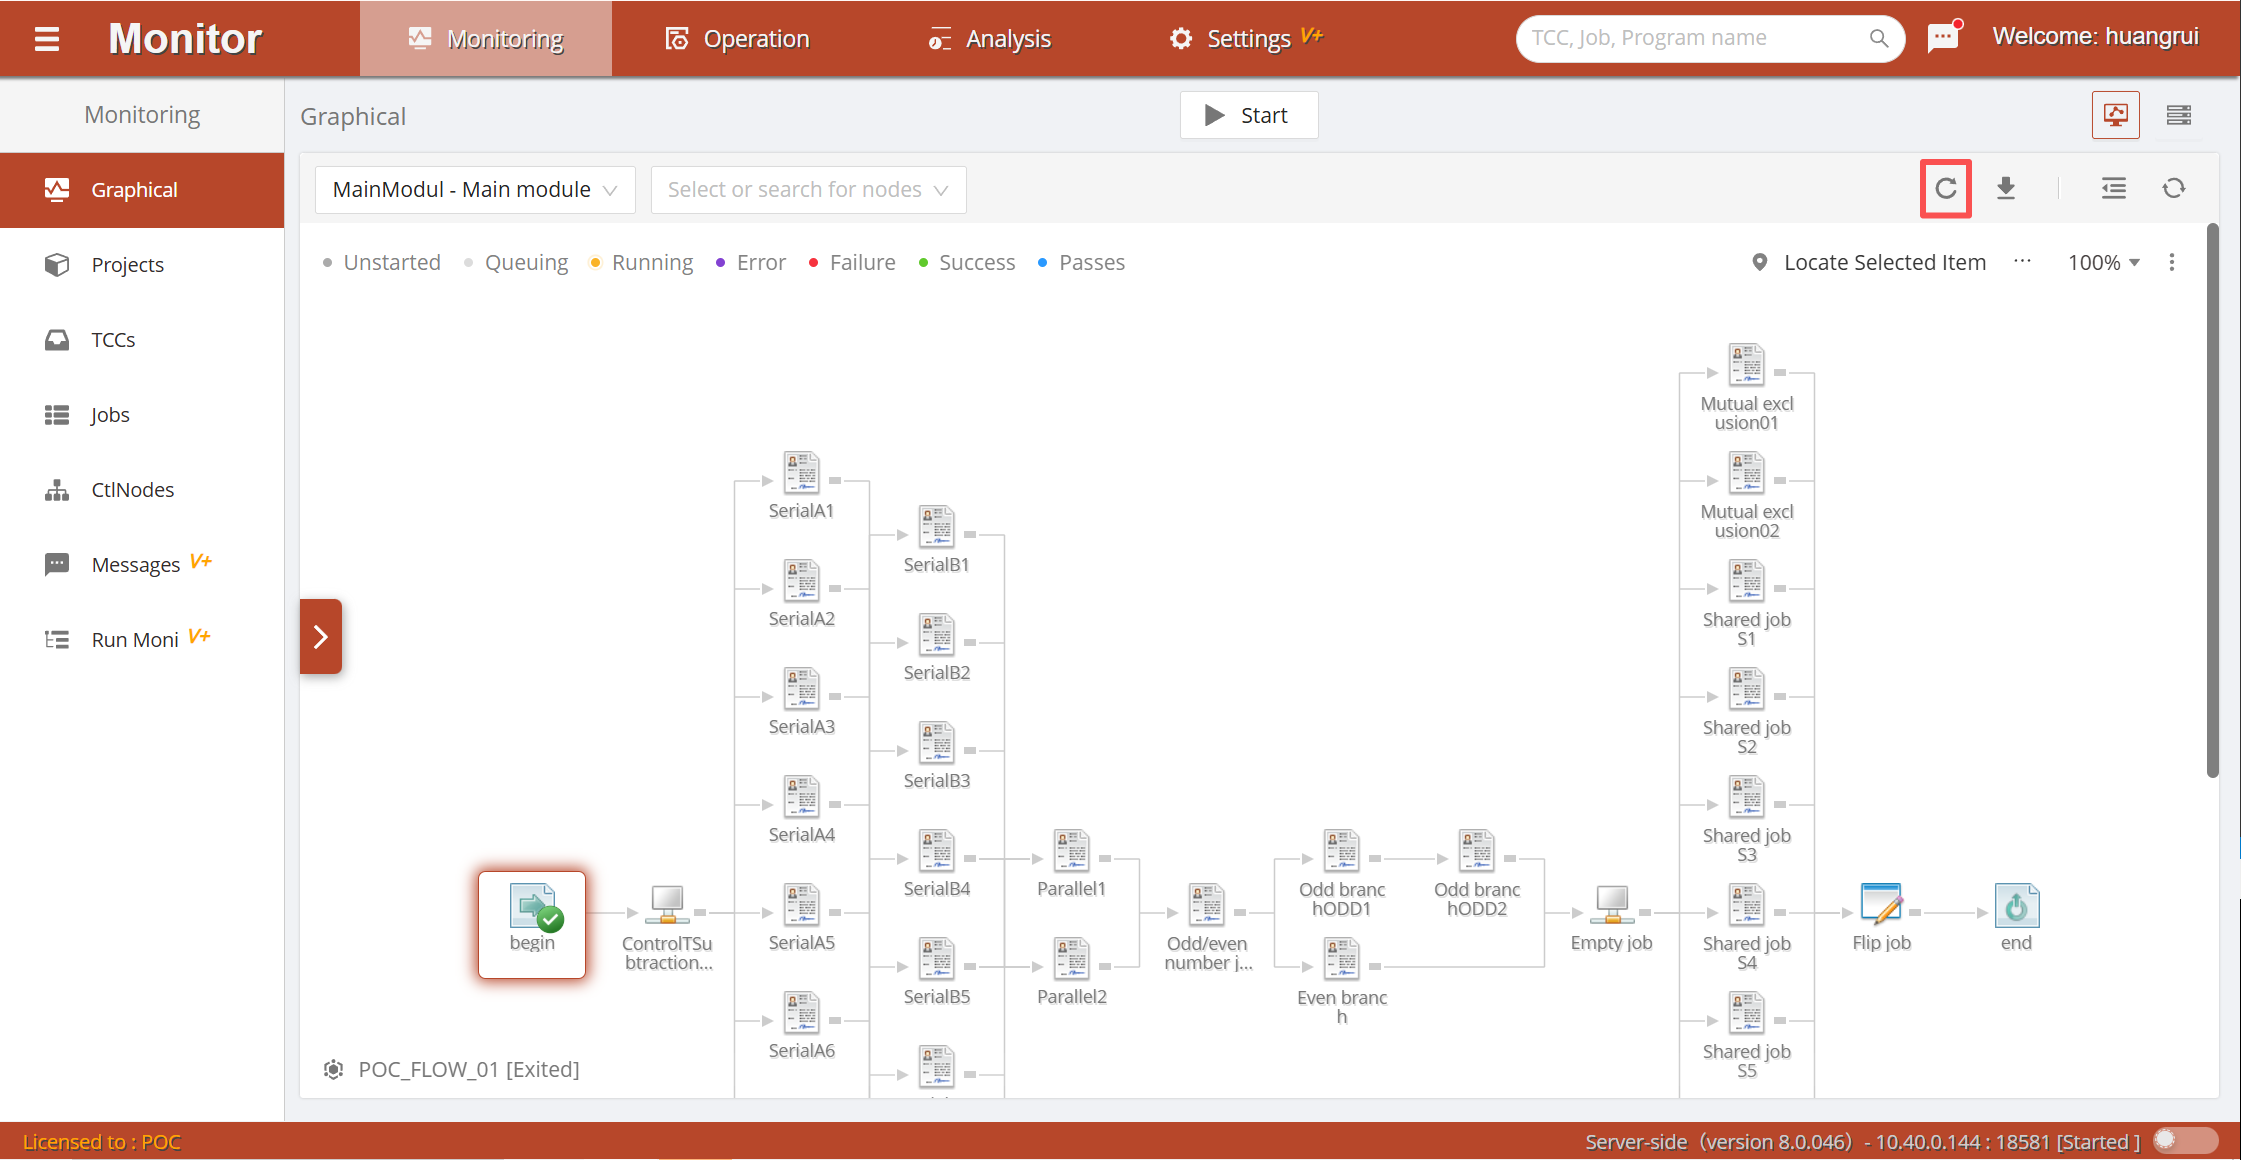
Reload Job Container
When the job container is stopped, click the  button in the toolbar to execute the reload operation, loading the latest released job container version, and the job status will also be reset to the initialized state.
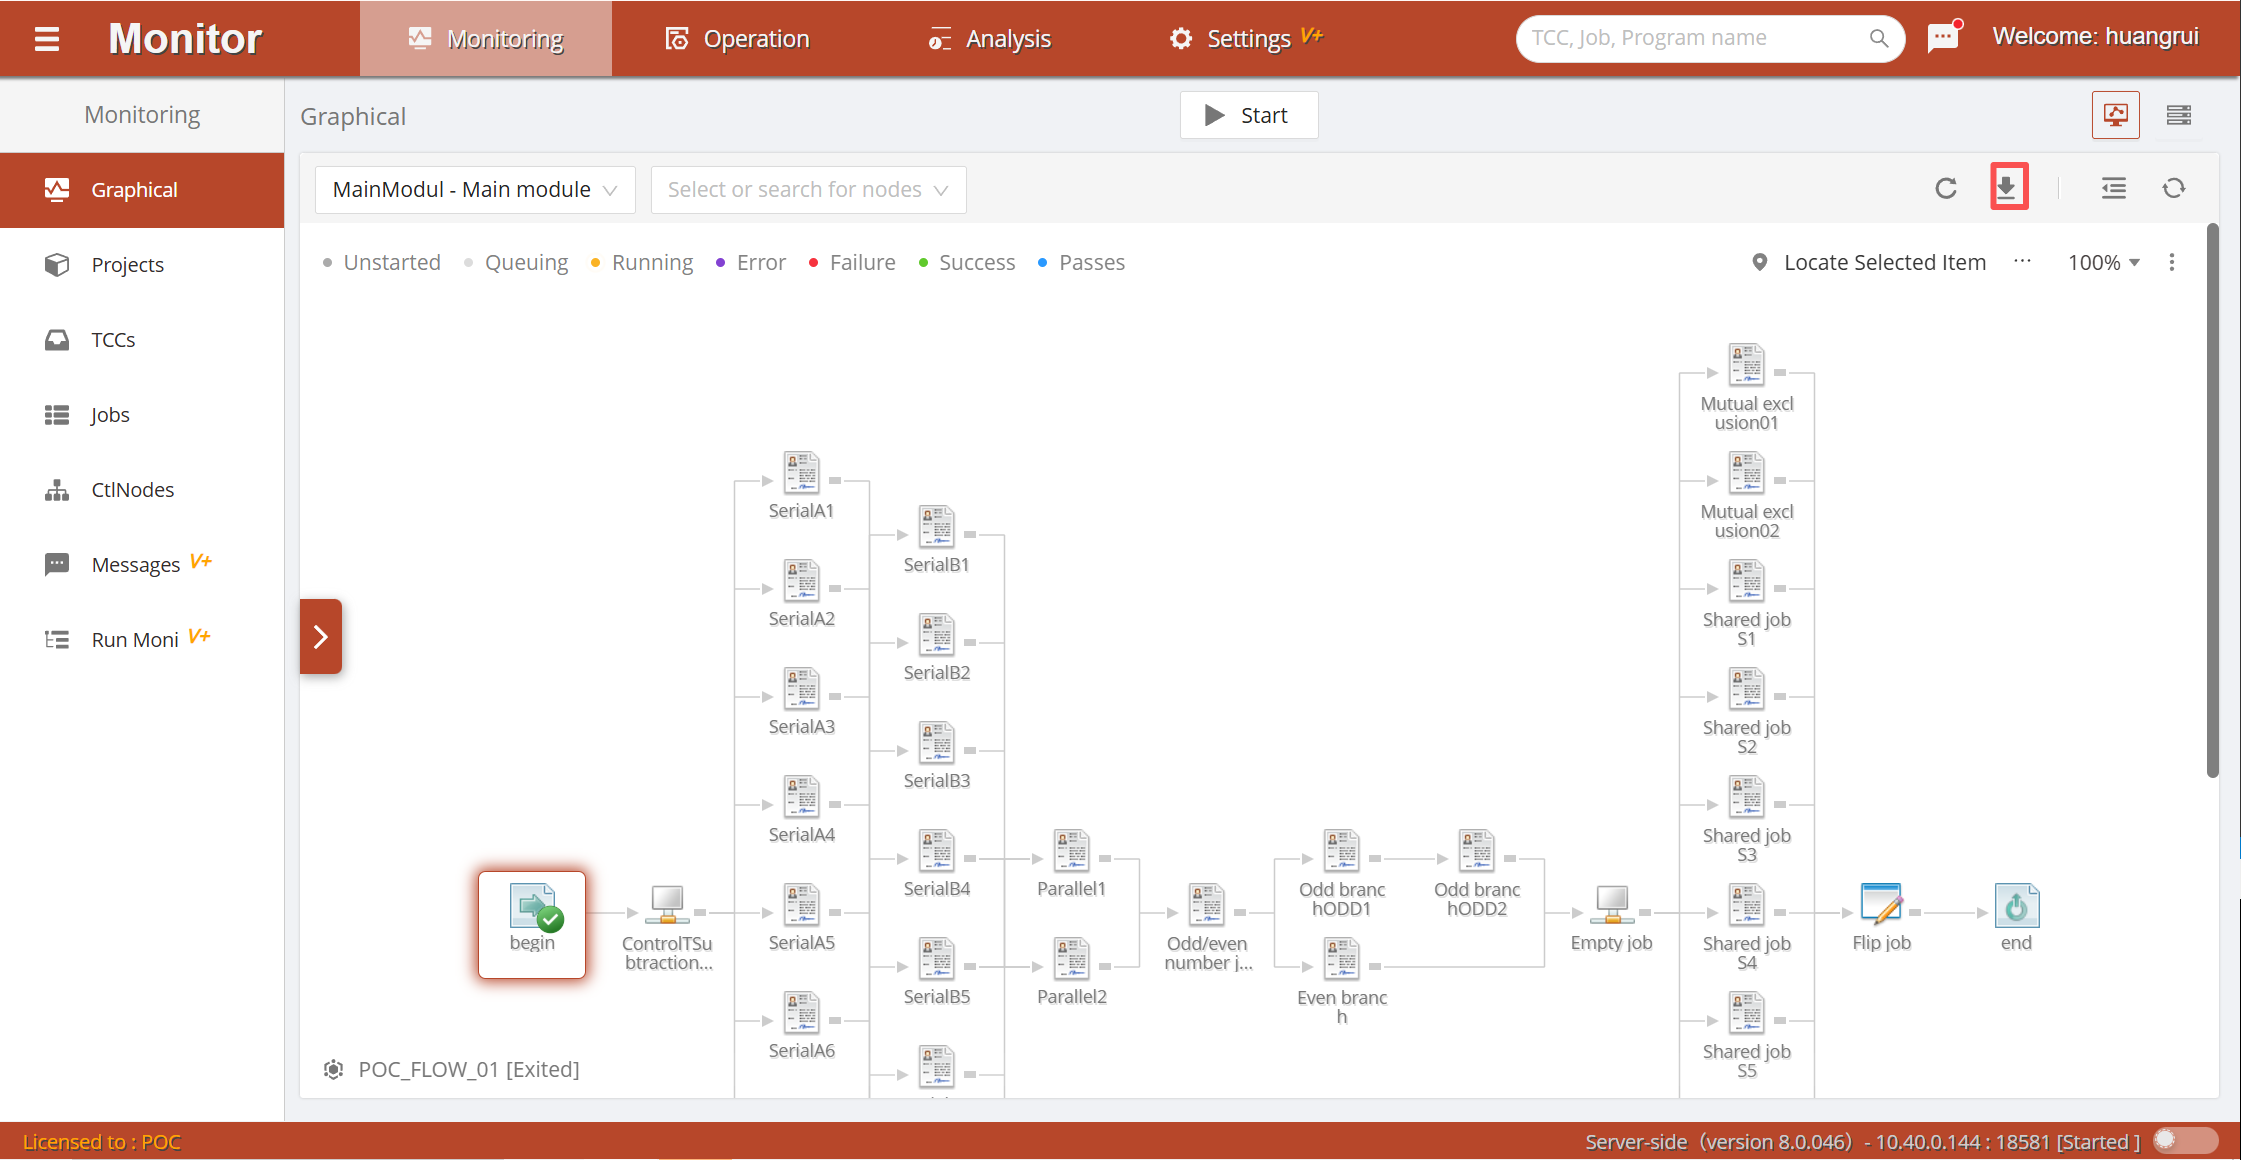
Job Properties Sidebar Window
The job status quick panel displays commonly used statuses, command menus, and simple attributes of a job. To view the complete running information of the current job, double-click the node in the graph or click the  button in the job status quick panel to open the properties window.
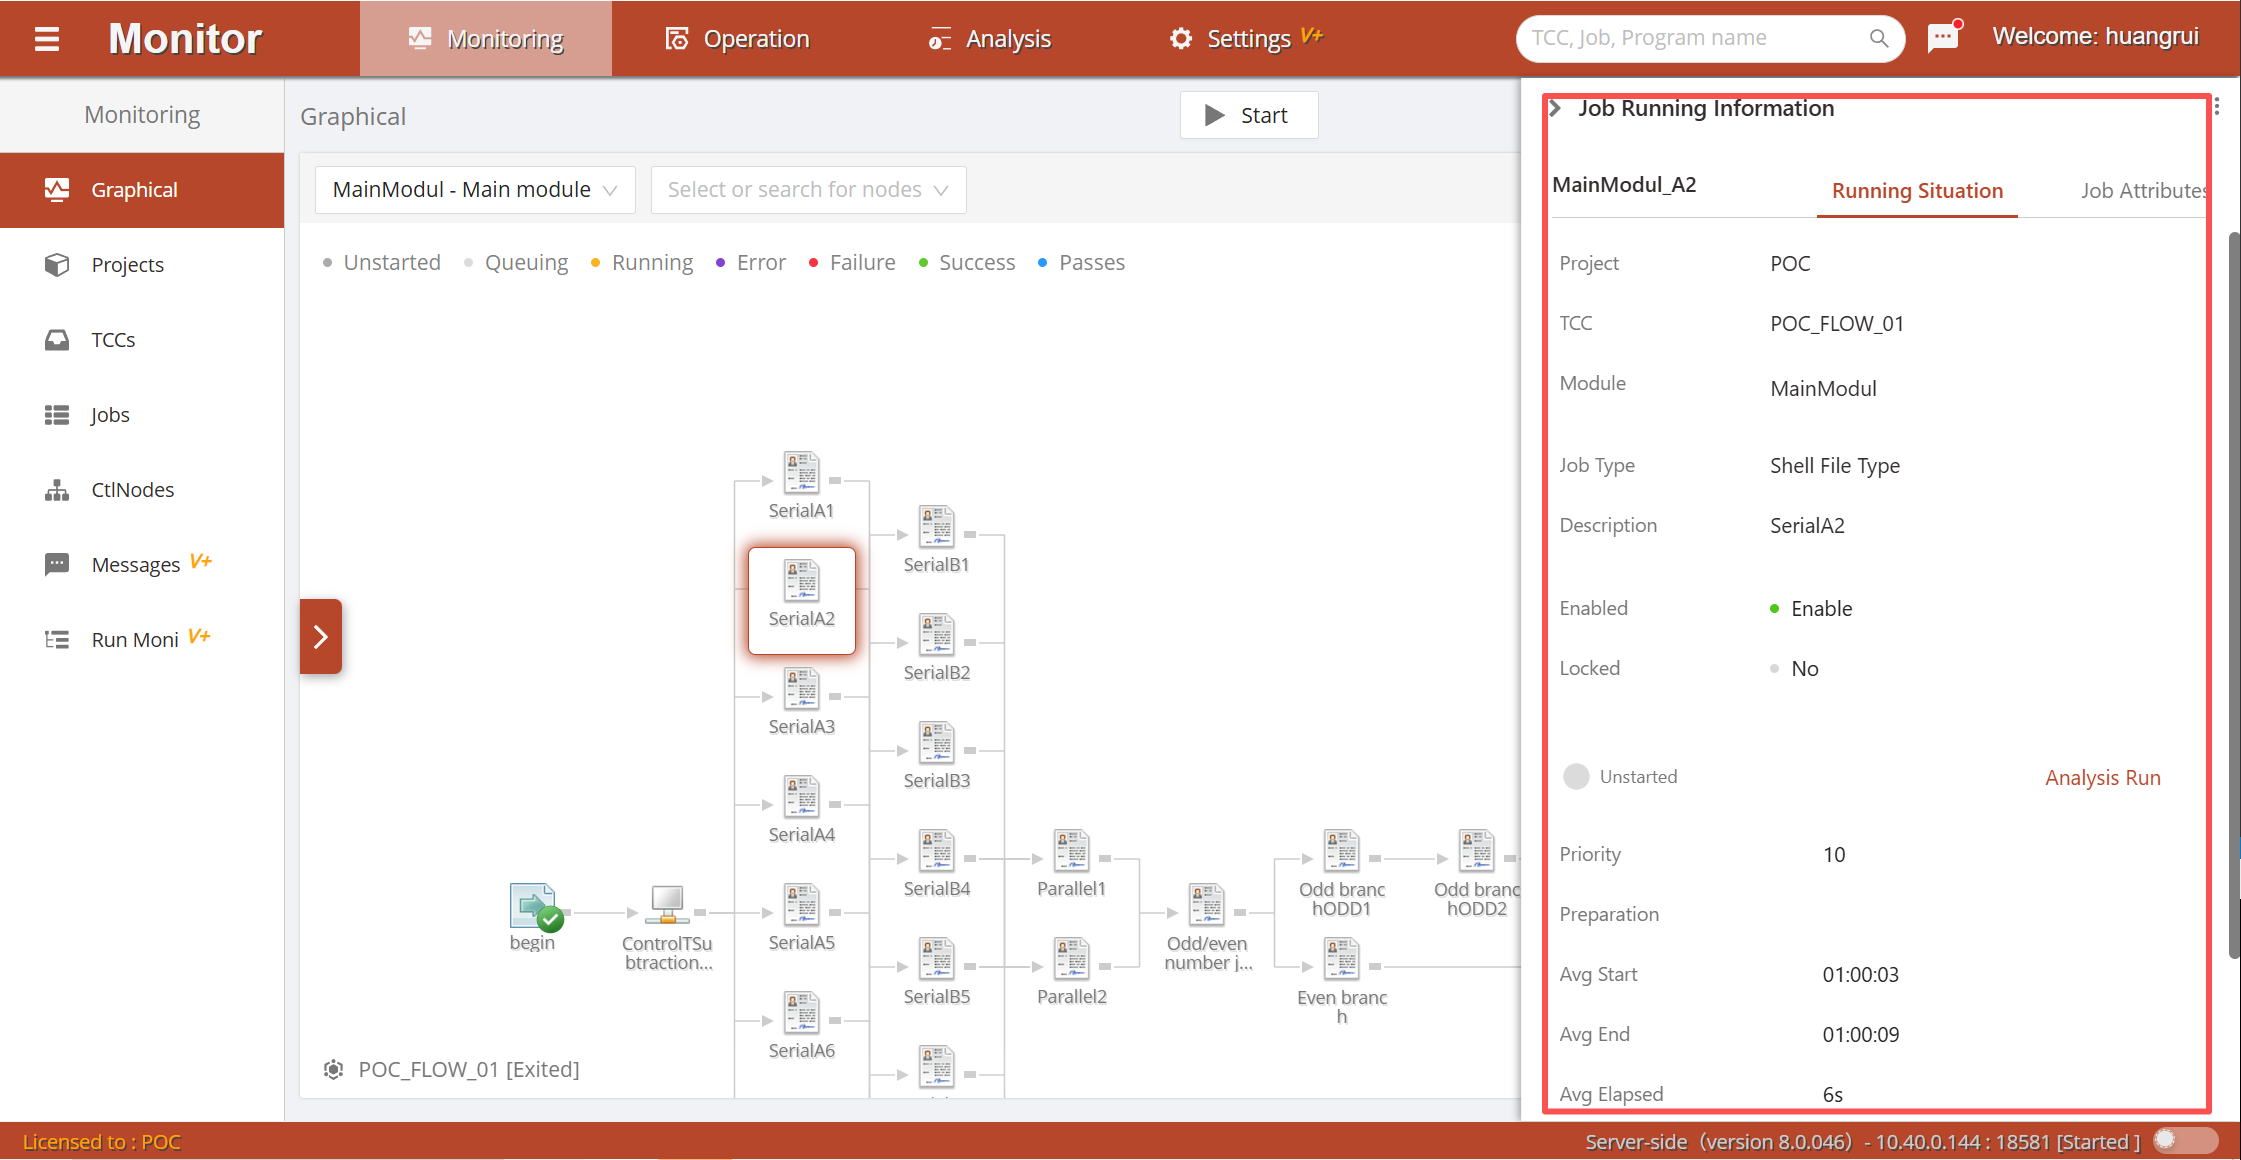
Job running information is divided into dynamic runtime attributes and static basic attributes.
Dynamic runtime attributes include: running status, start/end time, average duration, recent duration, estimated duration, running node produced after the job container runs, and manual interventions such as job disable or lock.
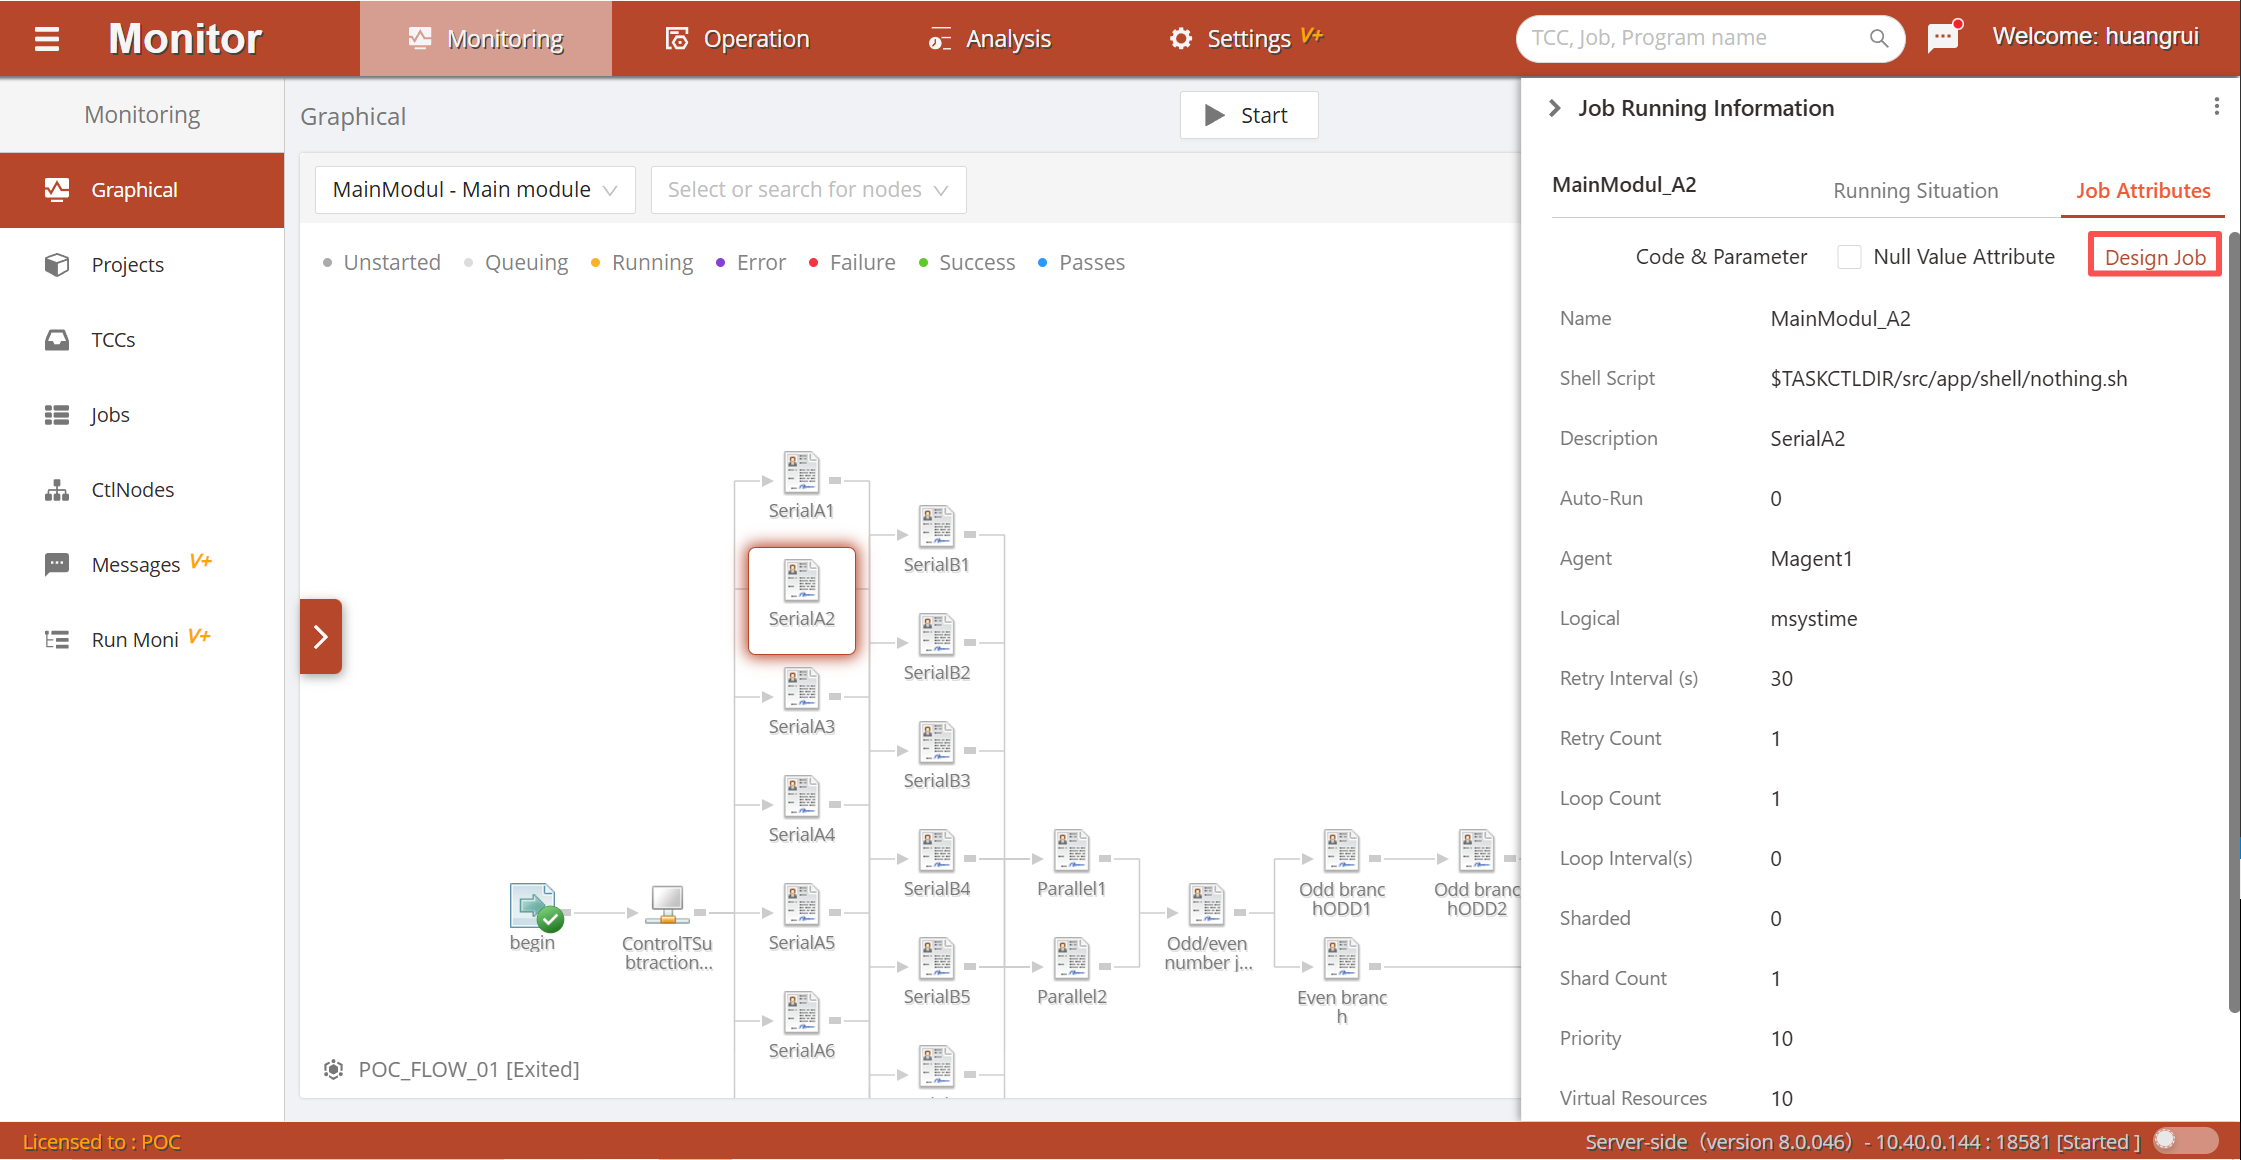
Static basic attributes include scheduling strategy attributes such as execution plan, conditions, fault tolerance, and loops. Also including referenced parameters and job code blocks. Click the link Go to Design Job to conveniently jump from the Monitor environment to the job location in the Designer environment.
Additionally, a list view is also provided to view the job running status of the current job container in list form.