Monitor Overview
Overview
Monitor is mainly used for scheduling workflow monitoring and operation maintenance. Its main functions include: real-time monitoring, scheduling management, and operational analysis.
Real-time Monitoring: Multi-angle statistical monitoring of real-time data for platform operation. Scheduling Management: Operation management of scheduling objects. Operational Analysis: Multi-dimensional statistical analysis of running information.
Monitoring Homepage
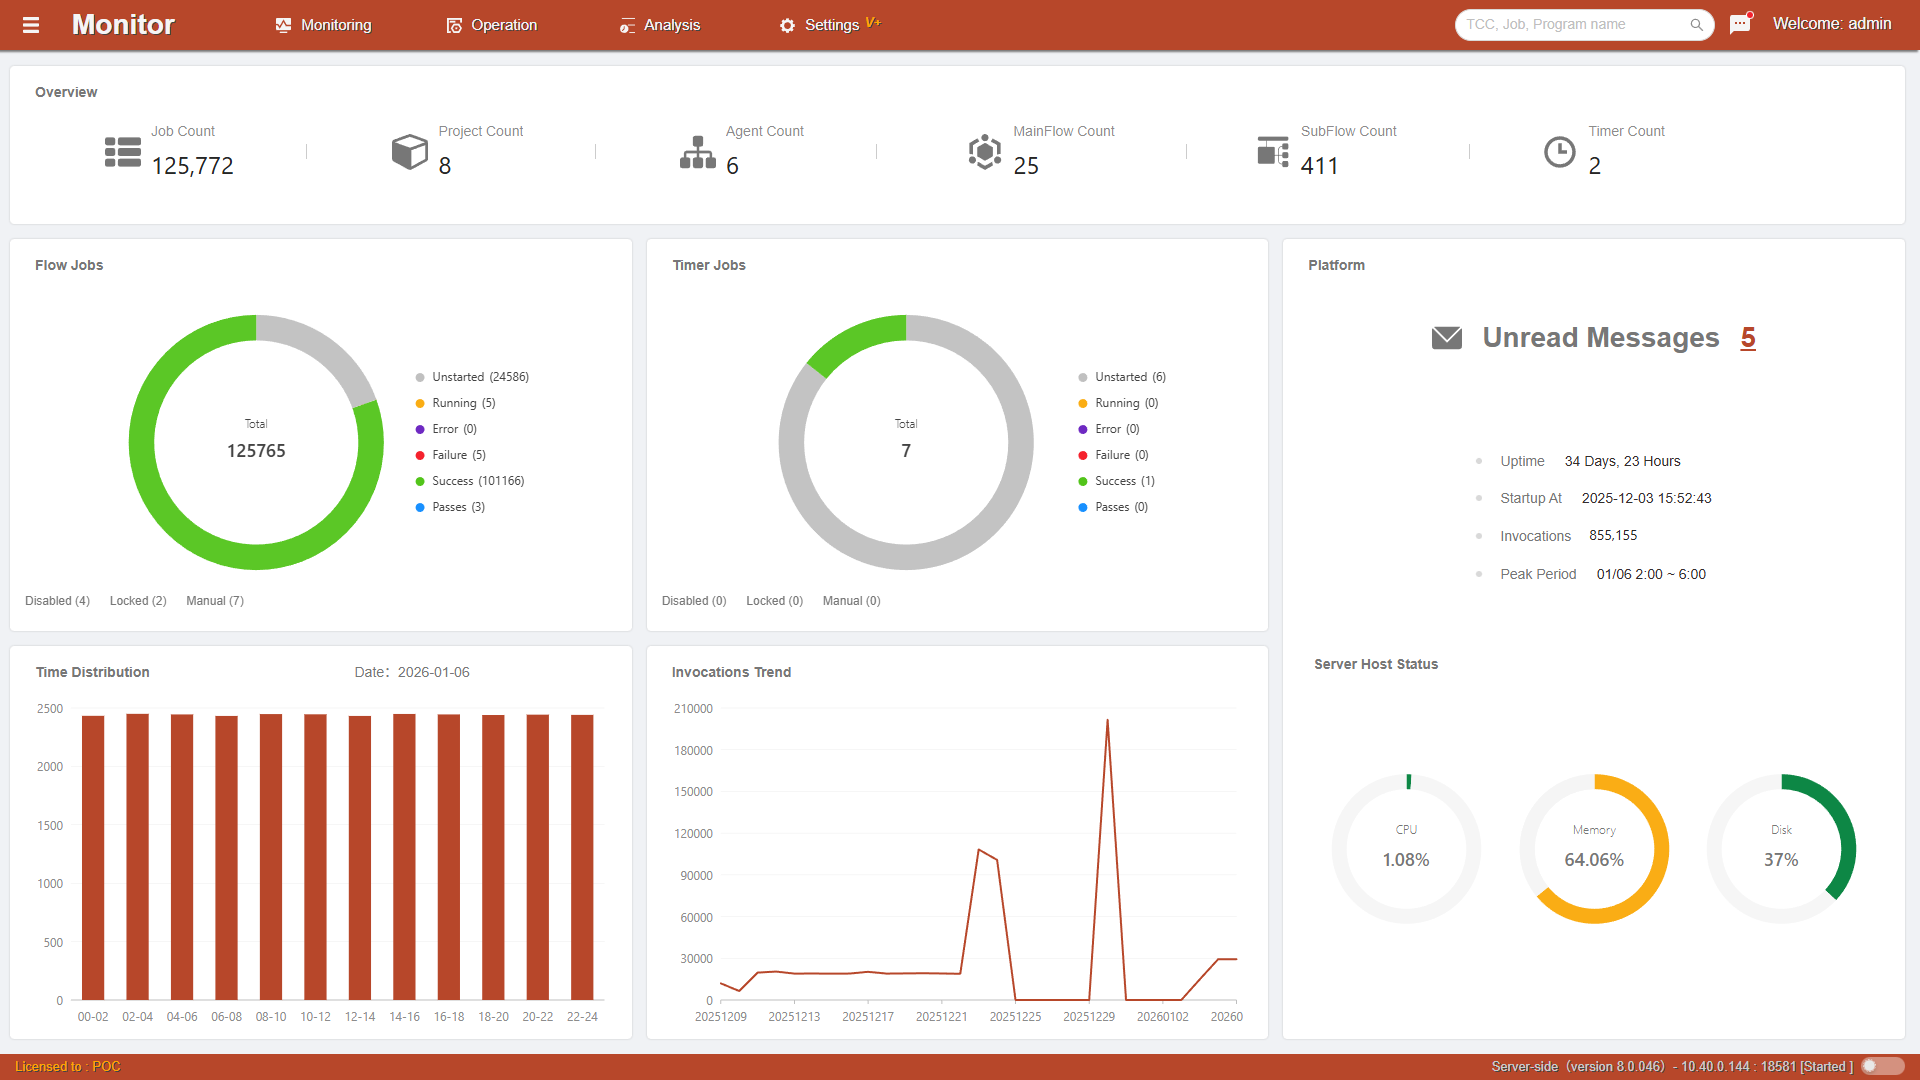
After a user logs into Monitor, the monitoring homepage is displayed by default. You can also click Monitor to quickly return to the monitoring homepage. The monitoring homepage displays monitoring overview statistics within the current user's project permissions, workflow and timer-level job running status monitoring, recent job running schedule distribution statistics, and daily job scheduling count trend statistics. It also includes platform message statistics, scheduling service node hardware resource status, and overall platform operation summary.
Monitoring Overview
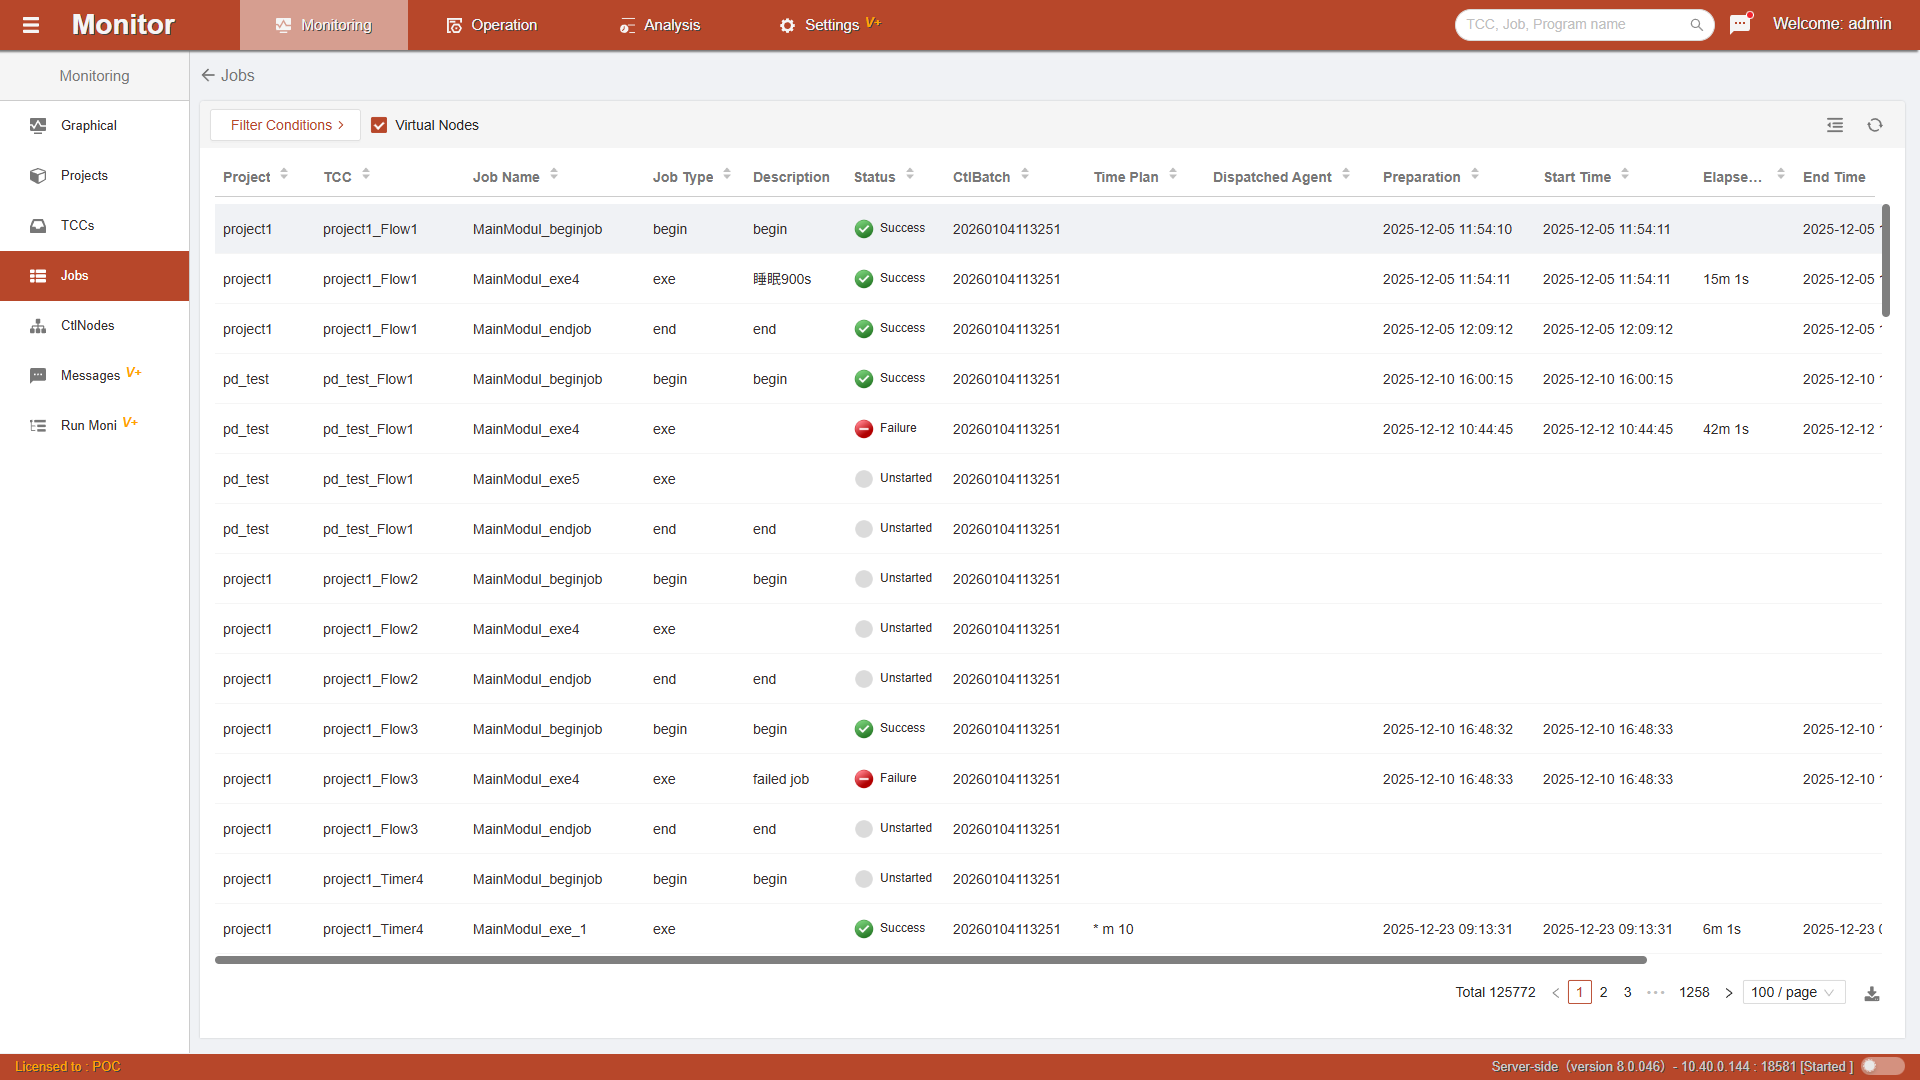
Statistics on the number of jobs, projects, agent control nodes managed by the user, as well as the number of MainFlow, JobFlow, and Timer job containers. Click Job Count to jump to the Job Monitoring page and display all job monitoring list data.
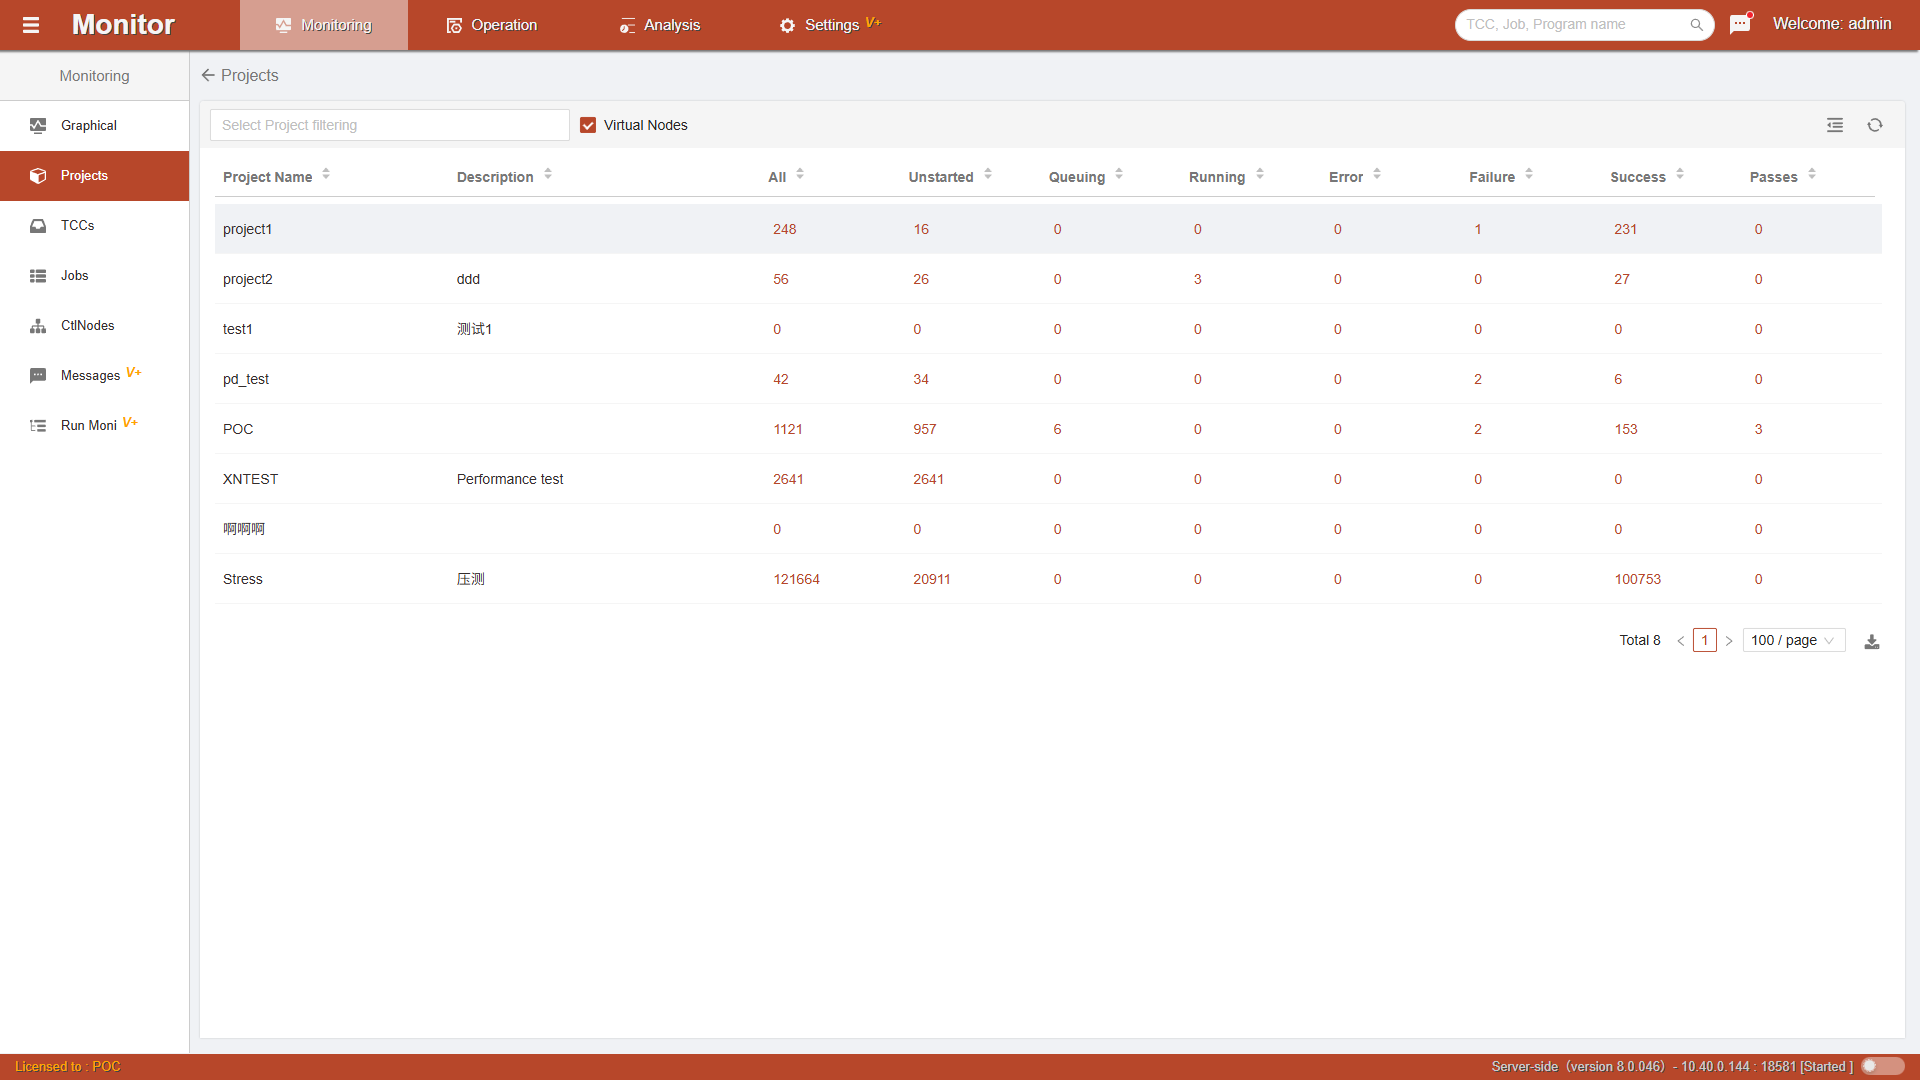
Click Project Count to jump to the Project Monitoring page and display project-level job running status statistics list data.
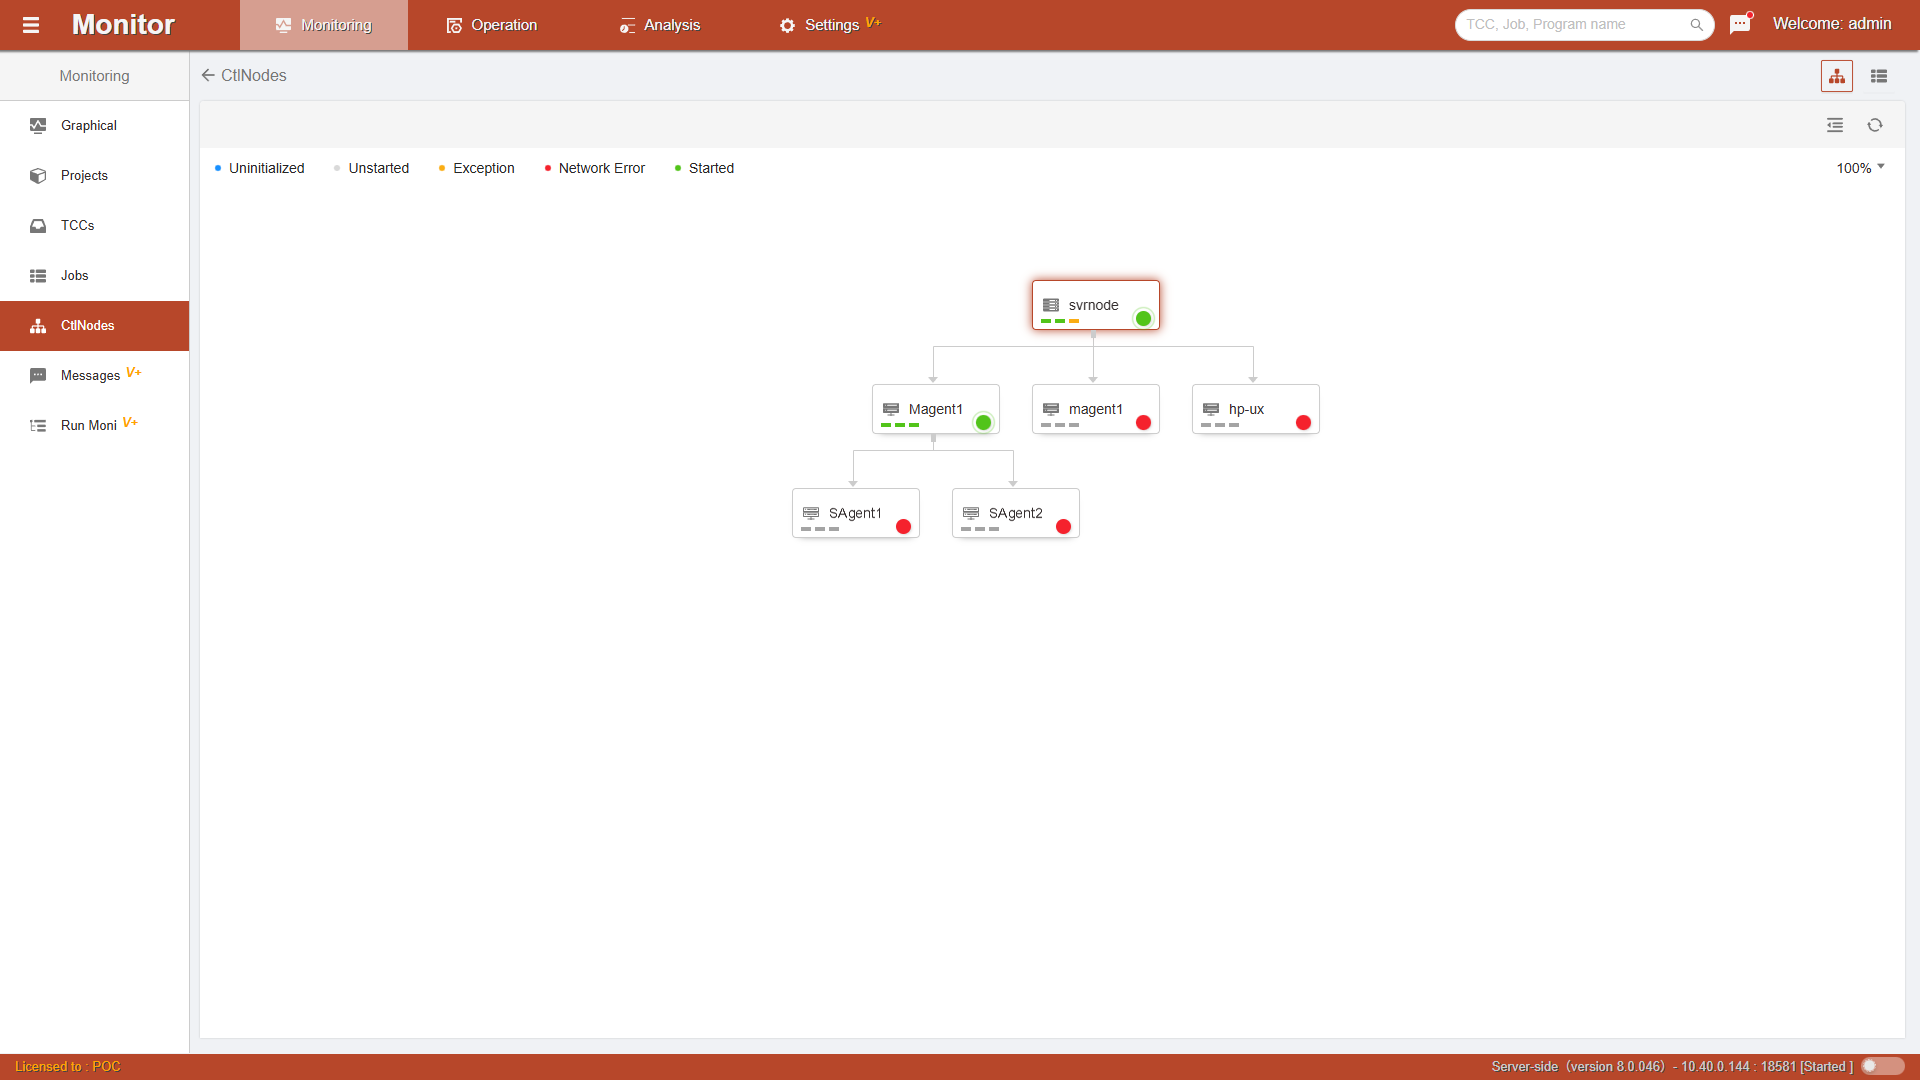
Click Agent Count to jump to the Node Monitoring page and display platform control node topology monitoring.
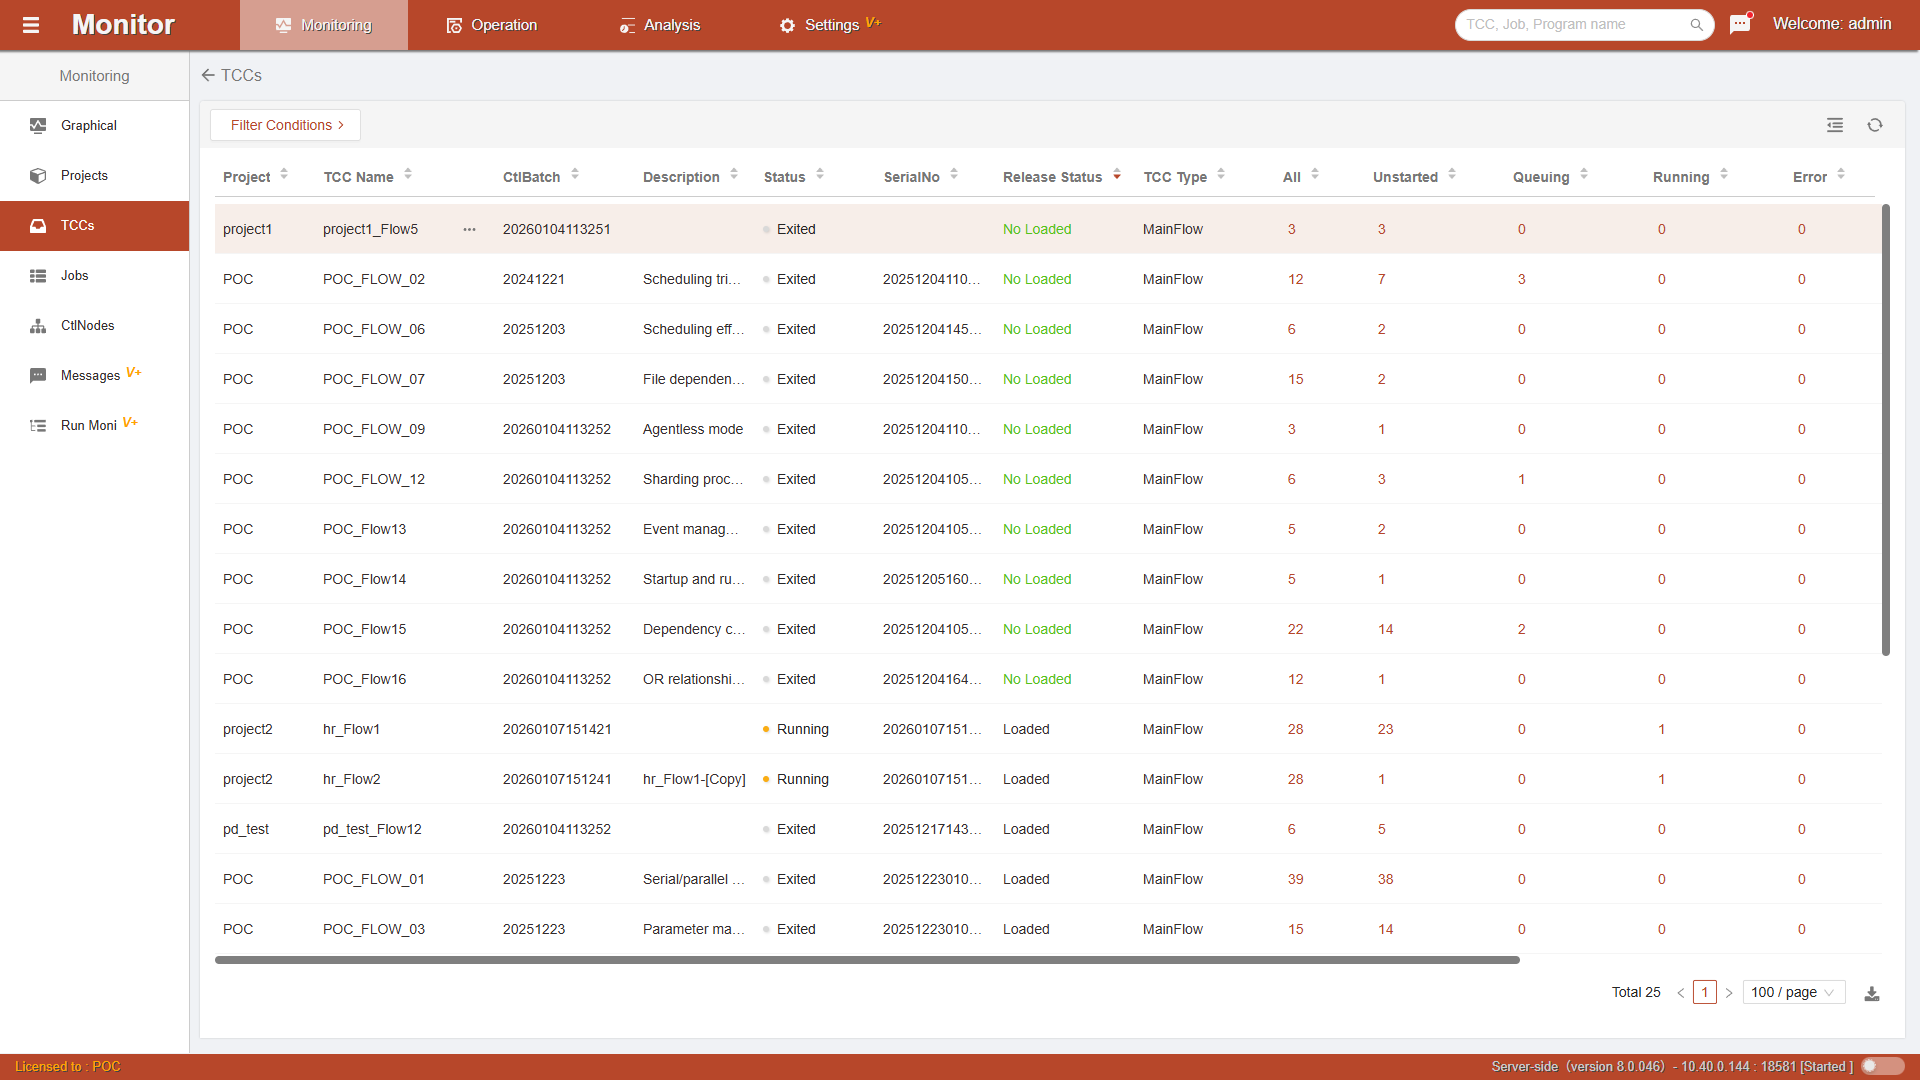
Click MainFlow Count to jump to the Container Monitoring page and display MainFlow-level job running status statistics list data.
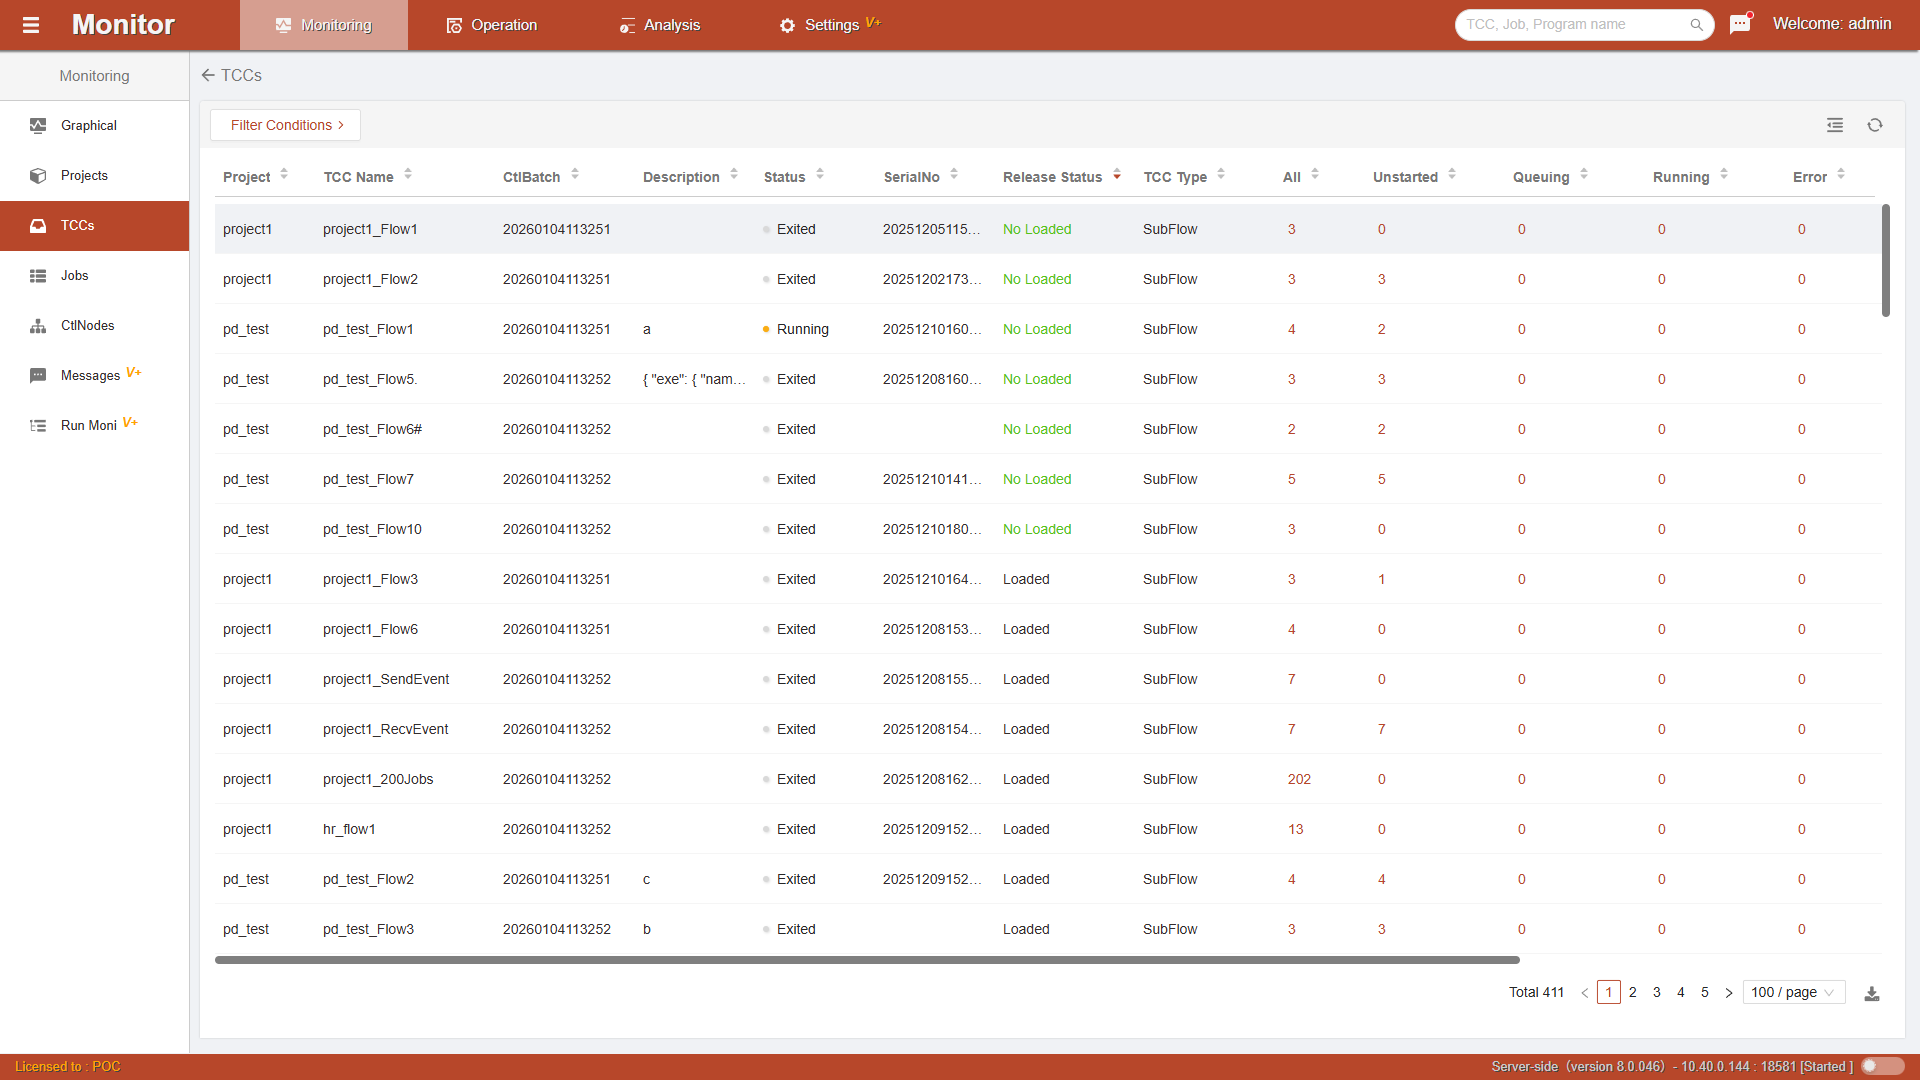
Click JobFlow Count to jump to the Container Monitoring page and display JobFlow-level job running status statistics list data.
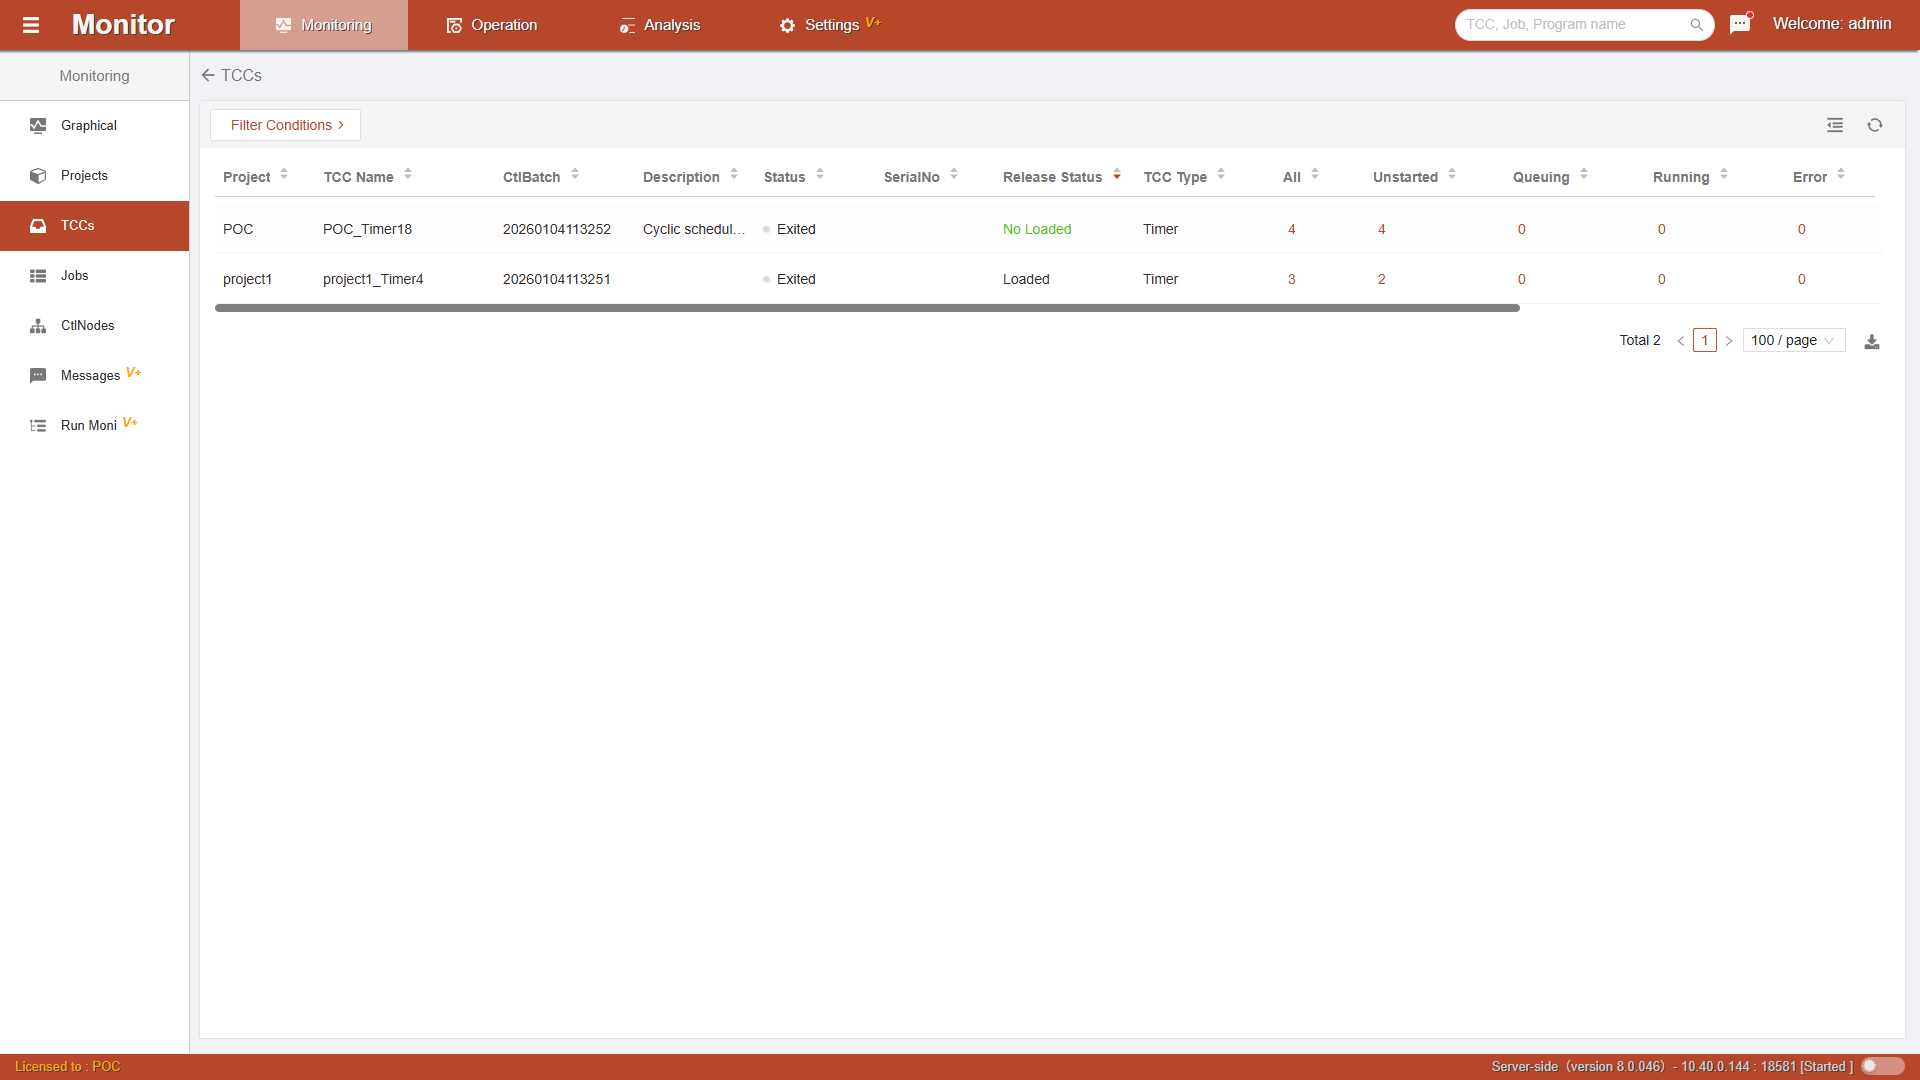
Click Timer Count to jump to the Container Monitoring page and display Timer-level job running status statistics list data.
Workflow Jobs and Timer Jobs
A donut chart is used to display the proportional distribution and count of job status statistics for all workflows (MainFlow / JobFlow) or timers. Below it, the total count of jobs with Disabled, Locked, and Manual status is displayed.
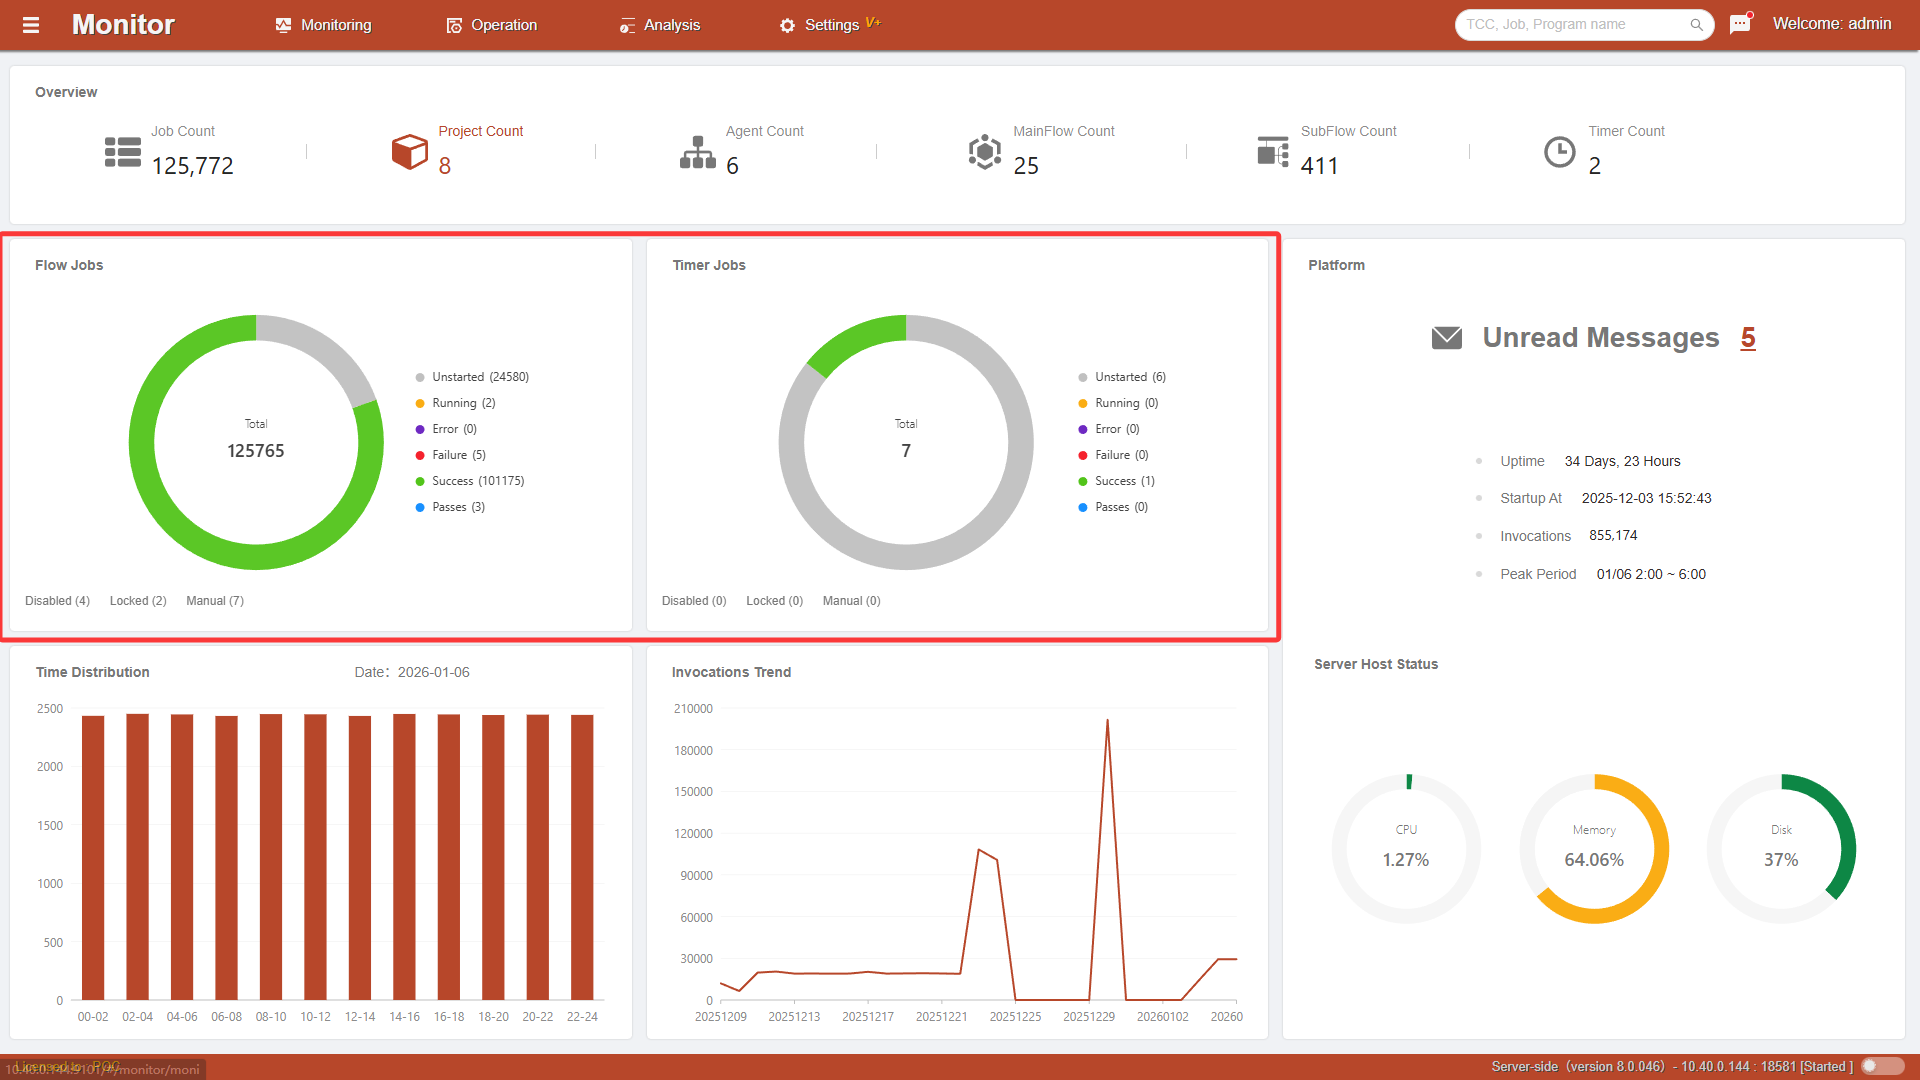
Click on the status ring area or label to jump to the Job Monitoring page and display the job monitoring list data for the specified status under the corresponding container.
Schedule Distribution
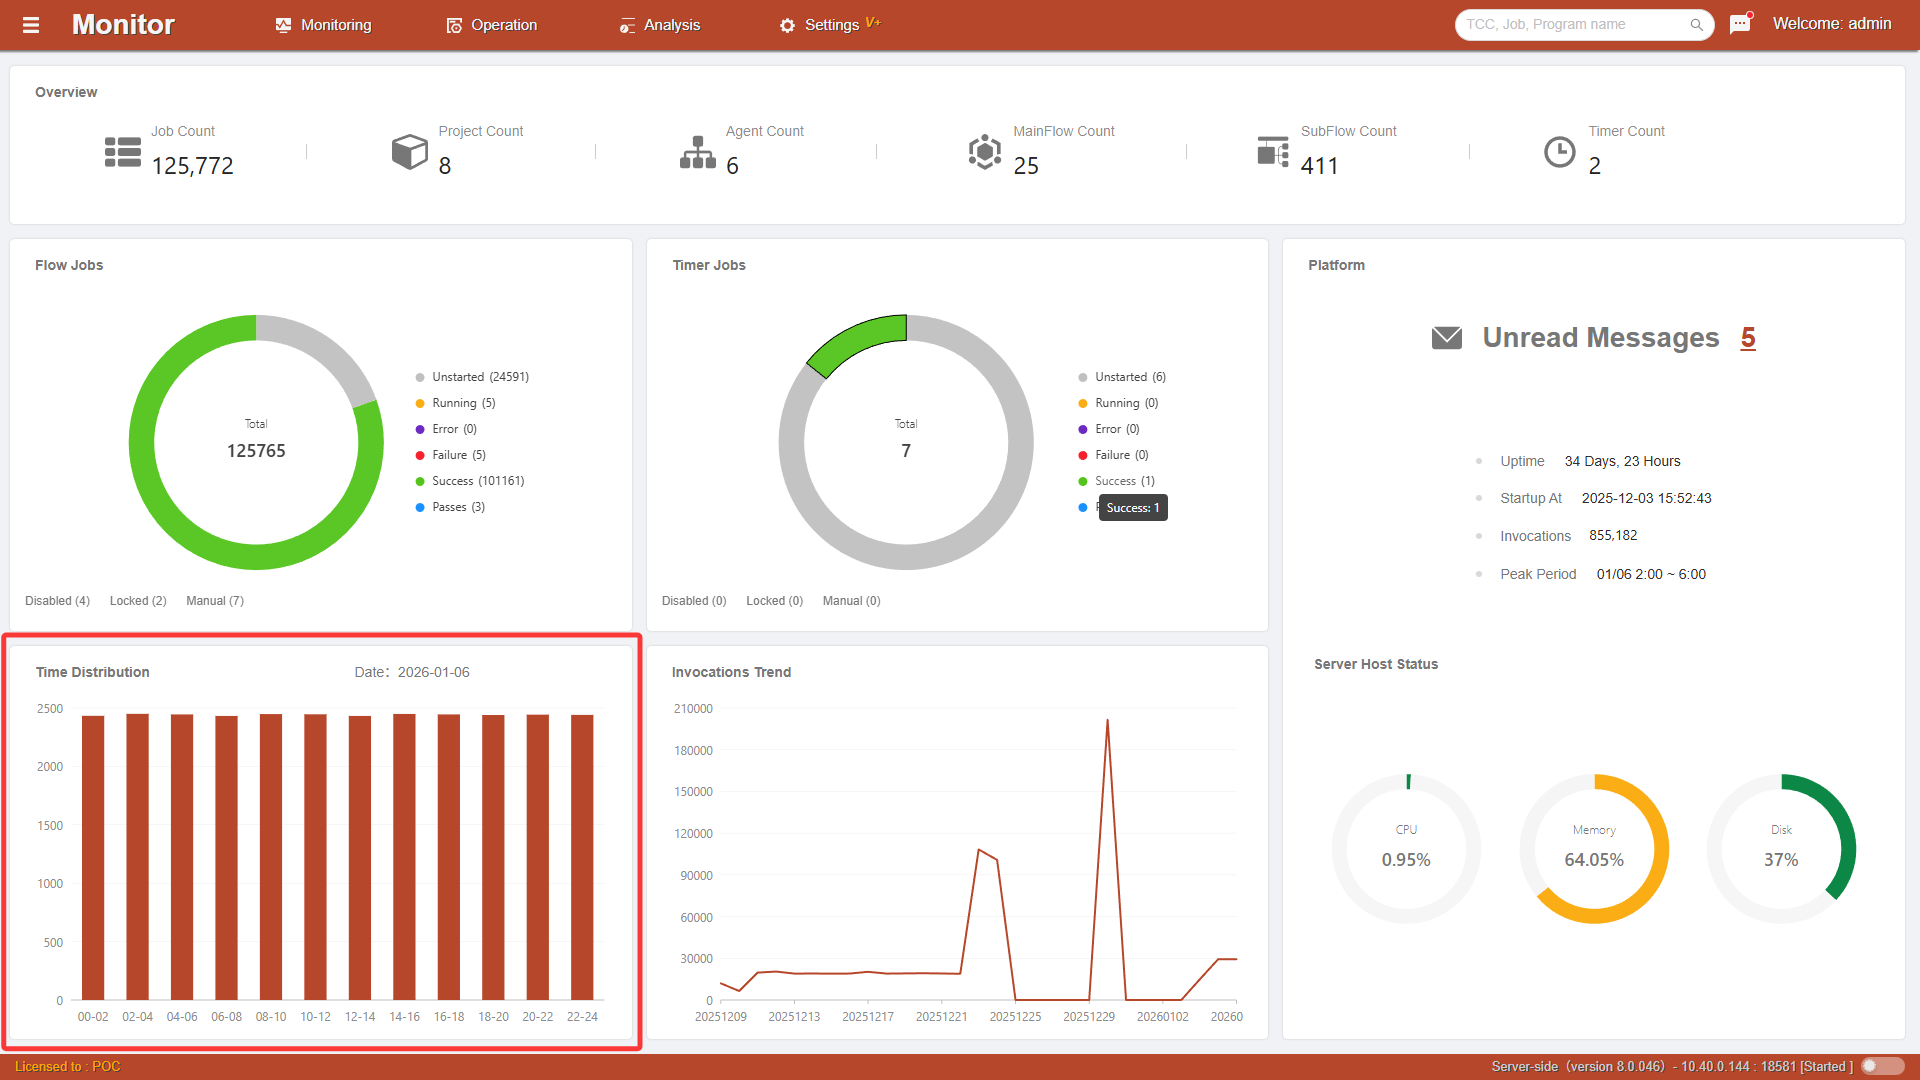
A bar chart is used to display the statistics of the number of platform jobs running by hour on the previous day.
Click on the bar area to jump to the Job History page and display the job running record list for the time period corresponding to the bar.
Scheduling Trend
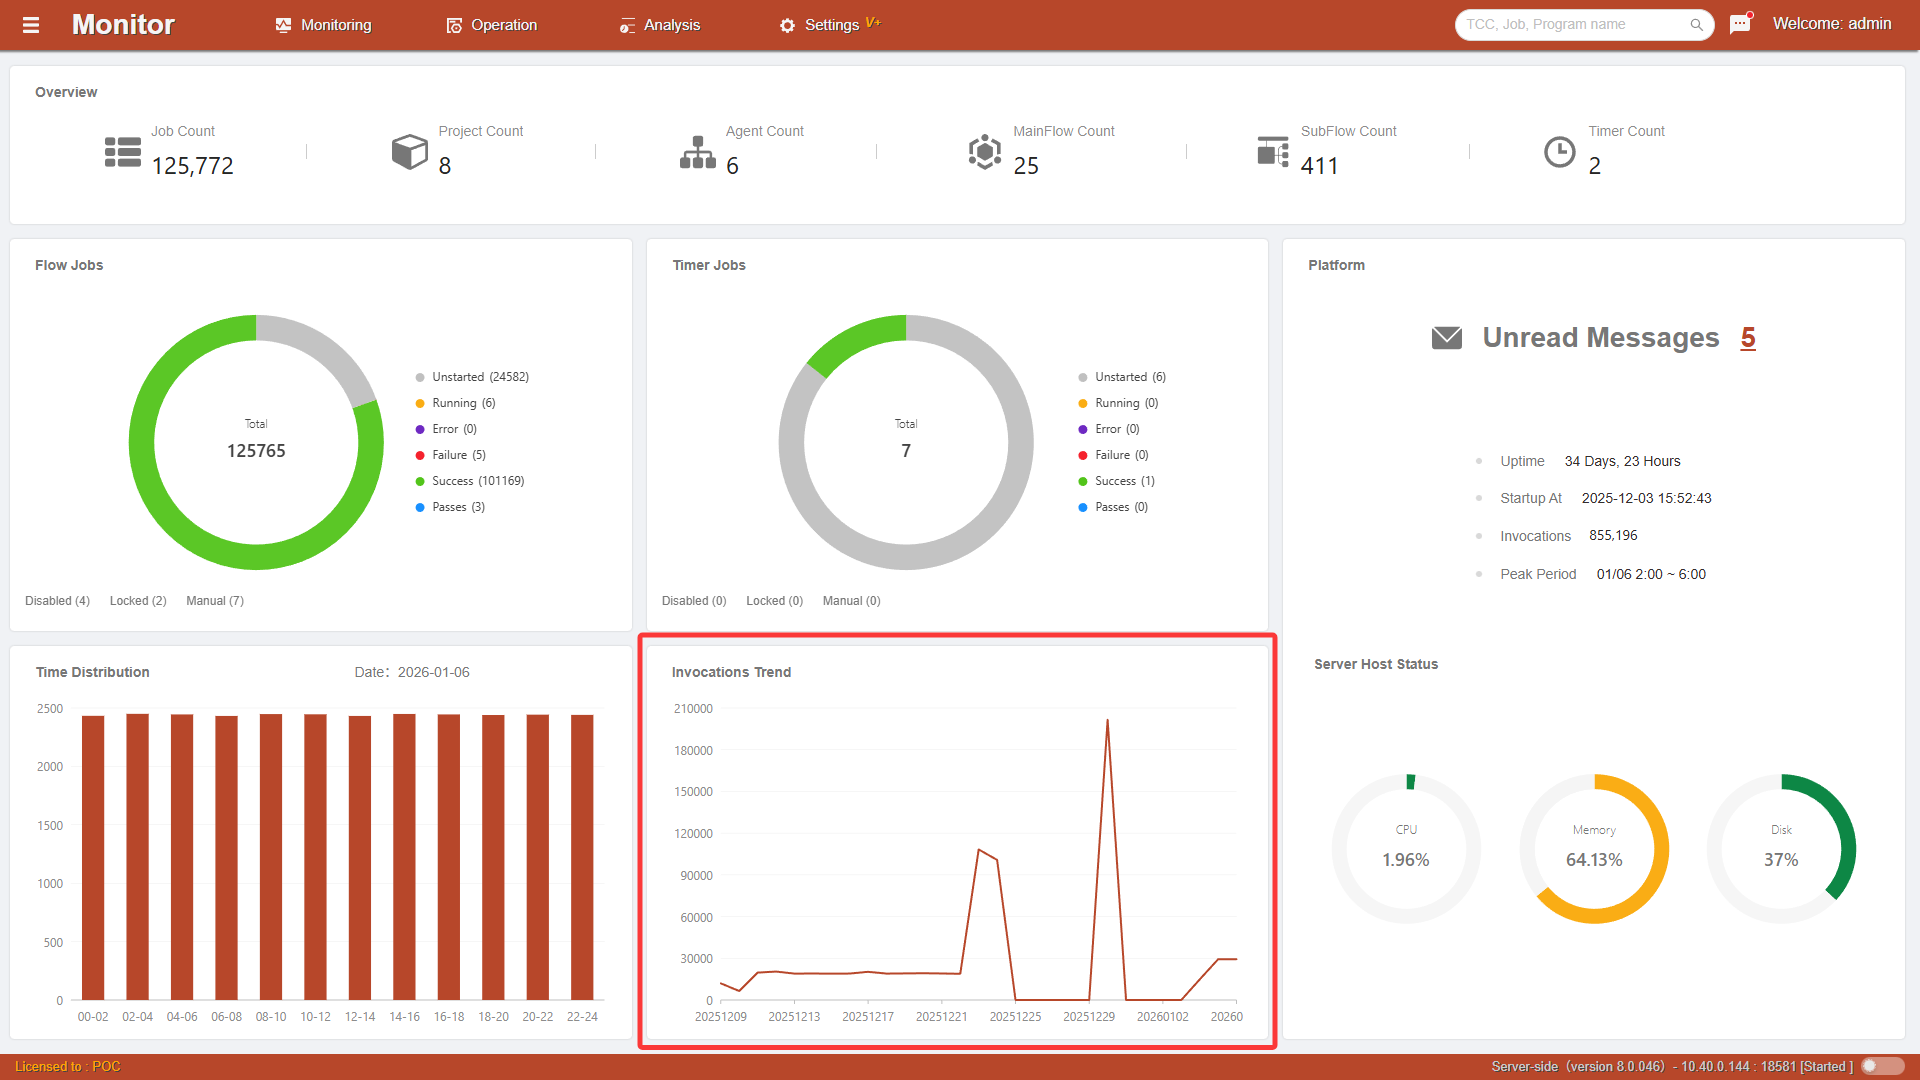
A line chart is used to display the daily job running count changes over a period of time.
Platform Information
New messages display the current unread message count. Click Message Count to jump to the Message Monitoring page and display the message list received by the current user.
Cumulative platform time displays the cumulative running time since the scheduling service was first started.
Platform startup time displays the cumulative running time since the last scheduling service startup.
Cumulative job invocations display the cumulative number of job invocations since the scheduling service was first started.
Recent peak period displays the time period when the job running count peaked on the previous day.
Service Node Status
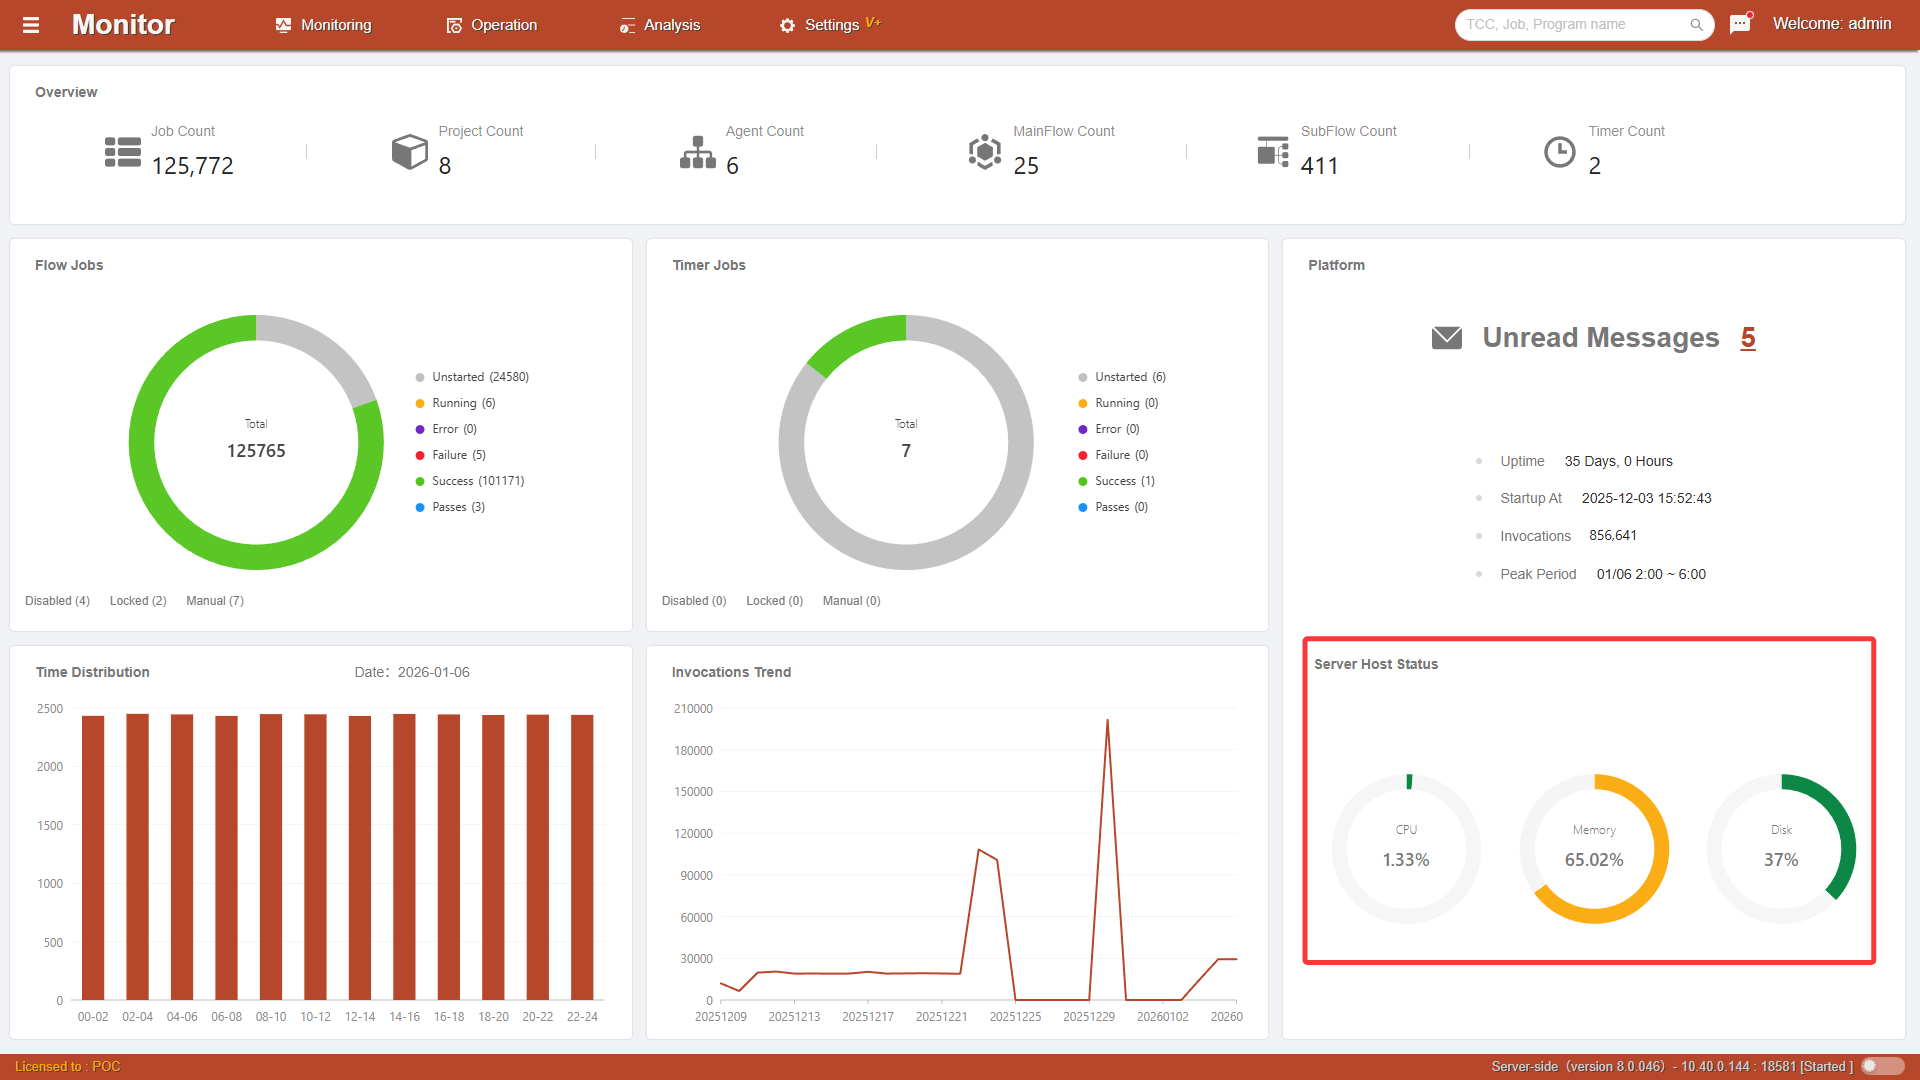
Displays the hardware resource usage of the scheduling service control nodes. When usage is below 60%, it is marked in green; when usage is above 60% and below 90%, it is marked in orange; when usage is above 90%, it is marked in red.
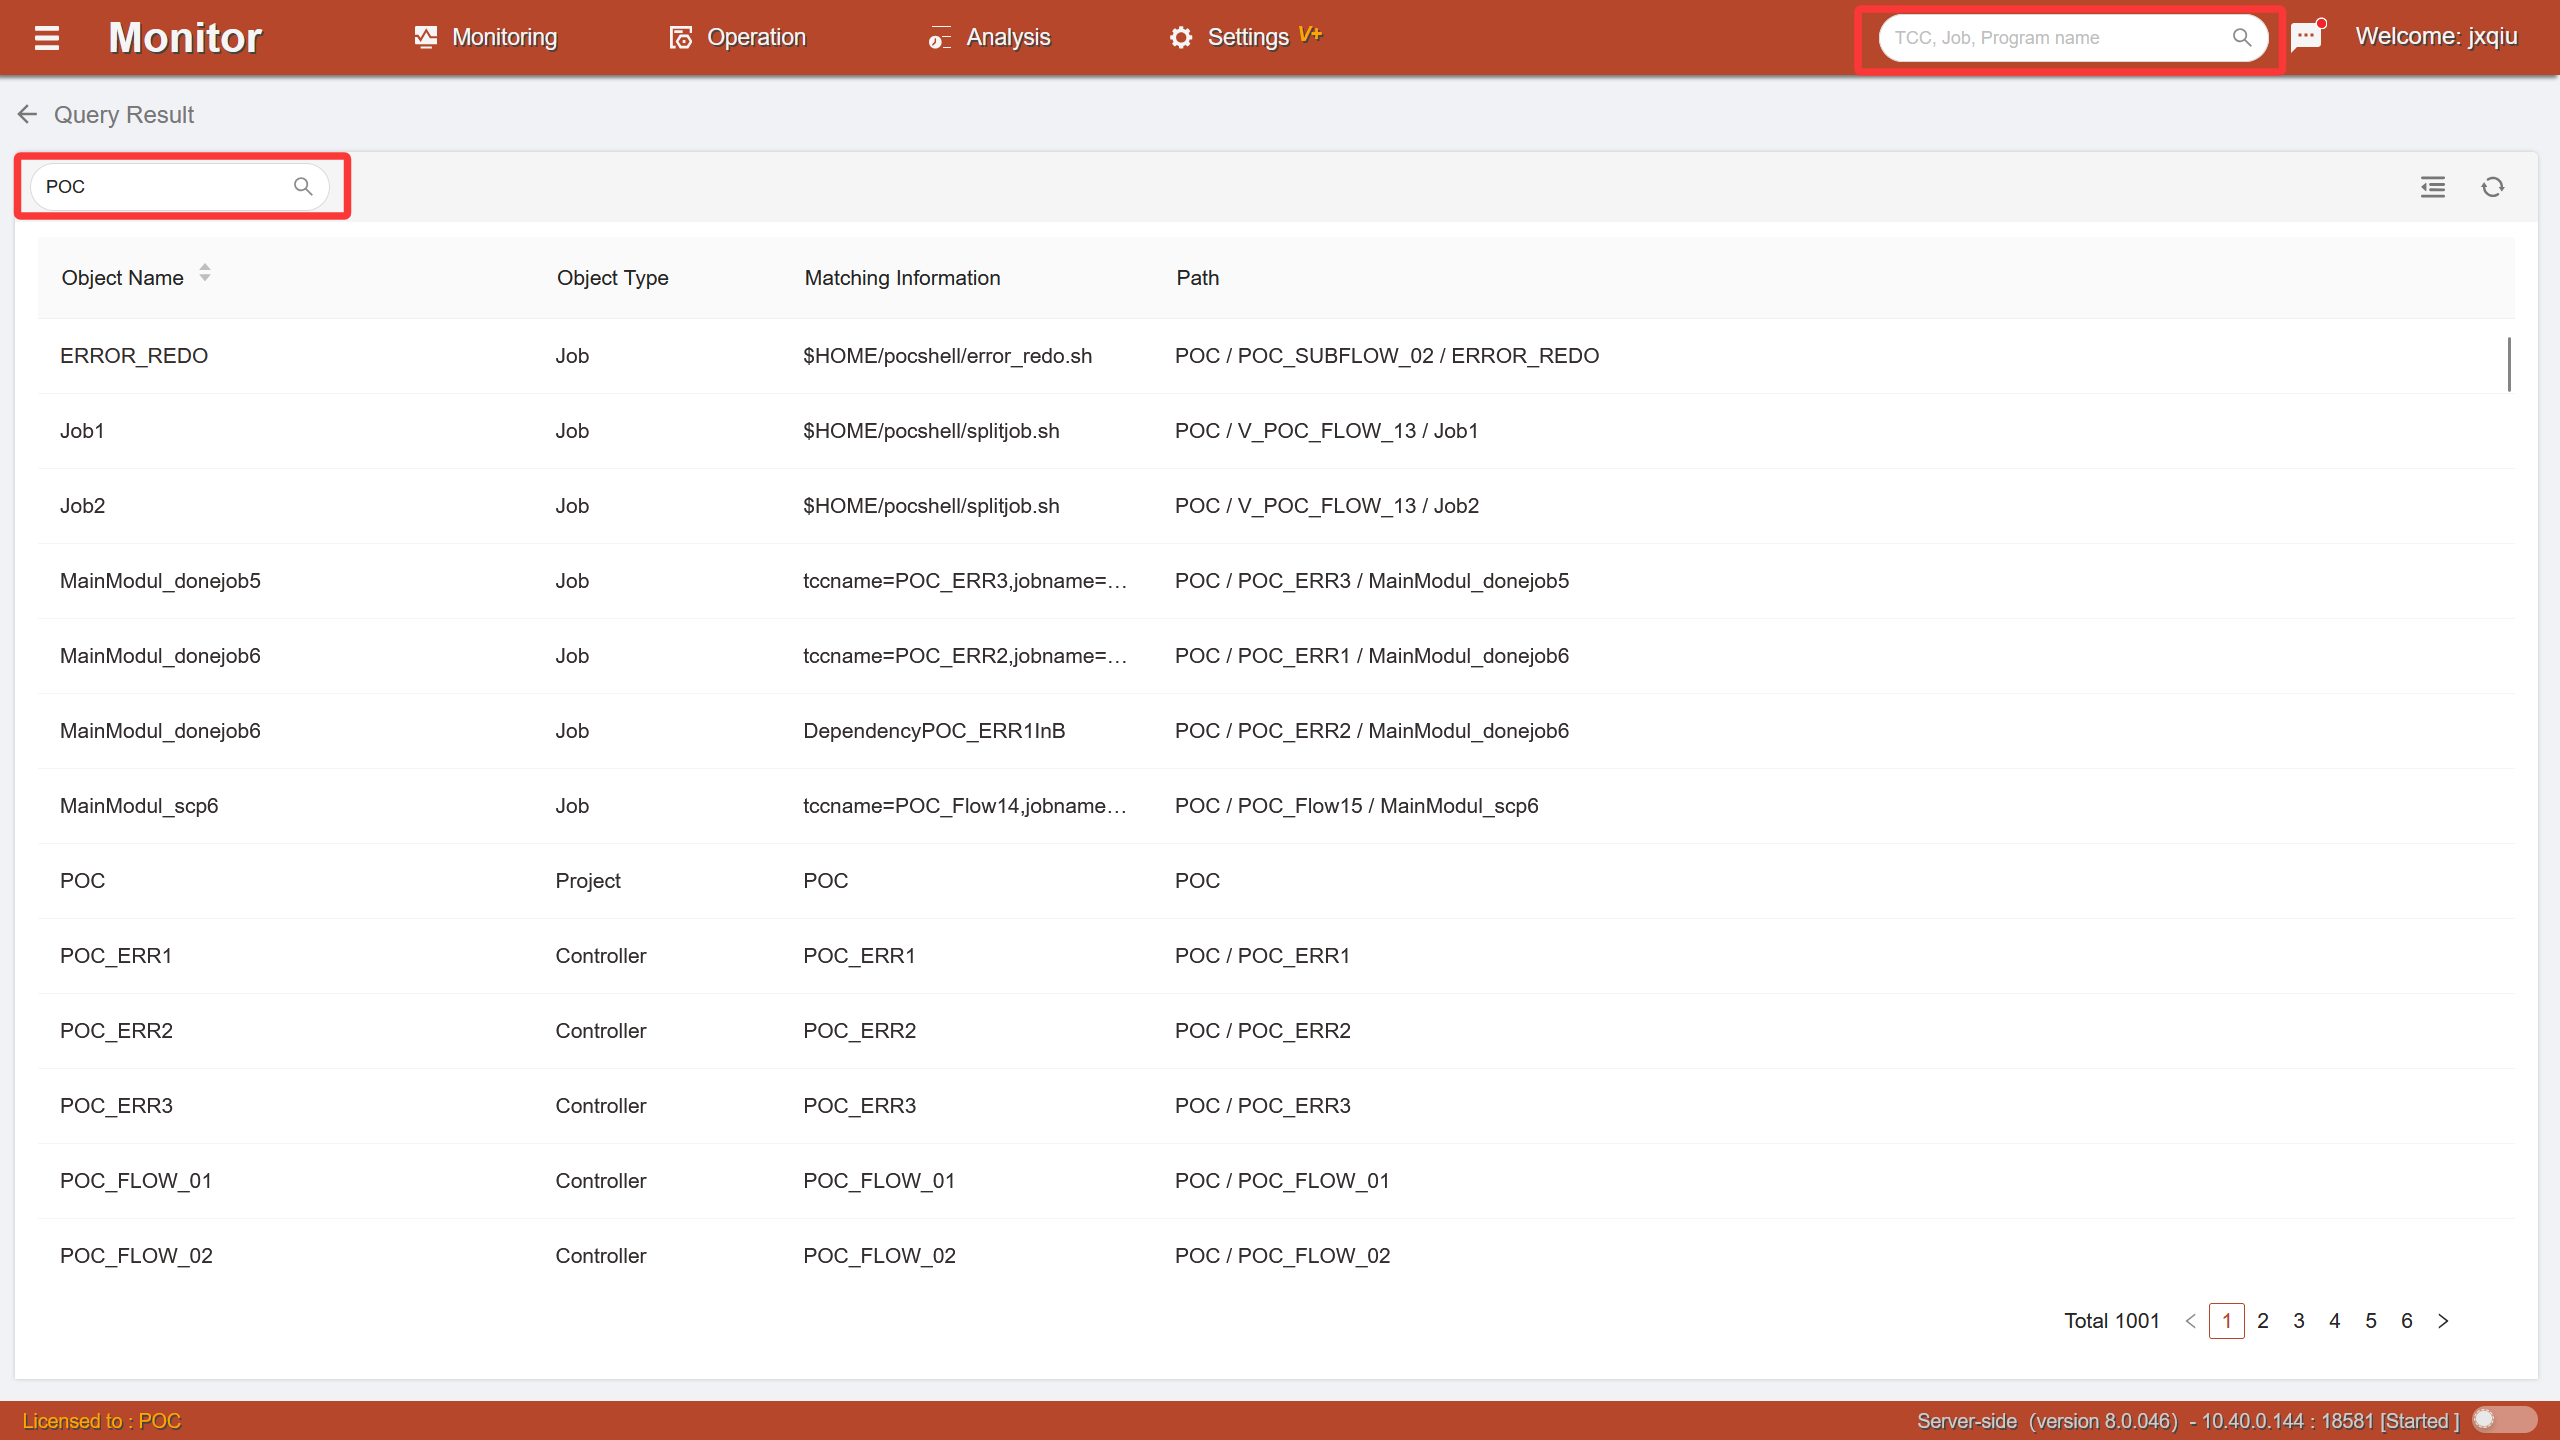
Search
In the search box at the top of the page, enter keywords for the object you want to query (including project, container, job name, and description) and press Enter to quickly index the related object list (projects, containers, modules, and jobs). Double-click on a data row to expand the object properties sidebar.