Statistical Monitoring
Monitoring summary from different perspectives.
Project Monitoring
Project monitoring uses Application Projects as the metric and job running status as the dimension. It provides real-time statistics on the count and summary of different job execution statuses under each Application Project. This is the top-level statistical method.
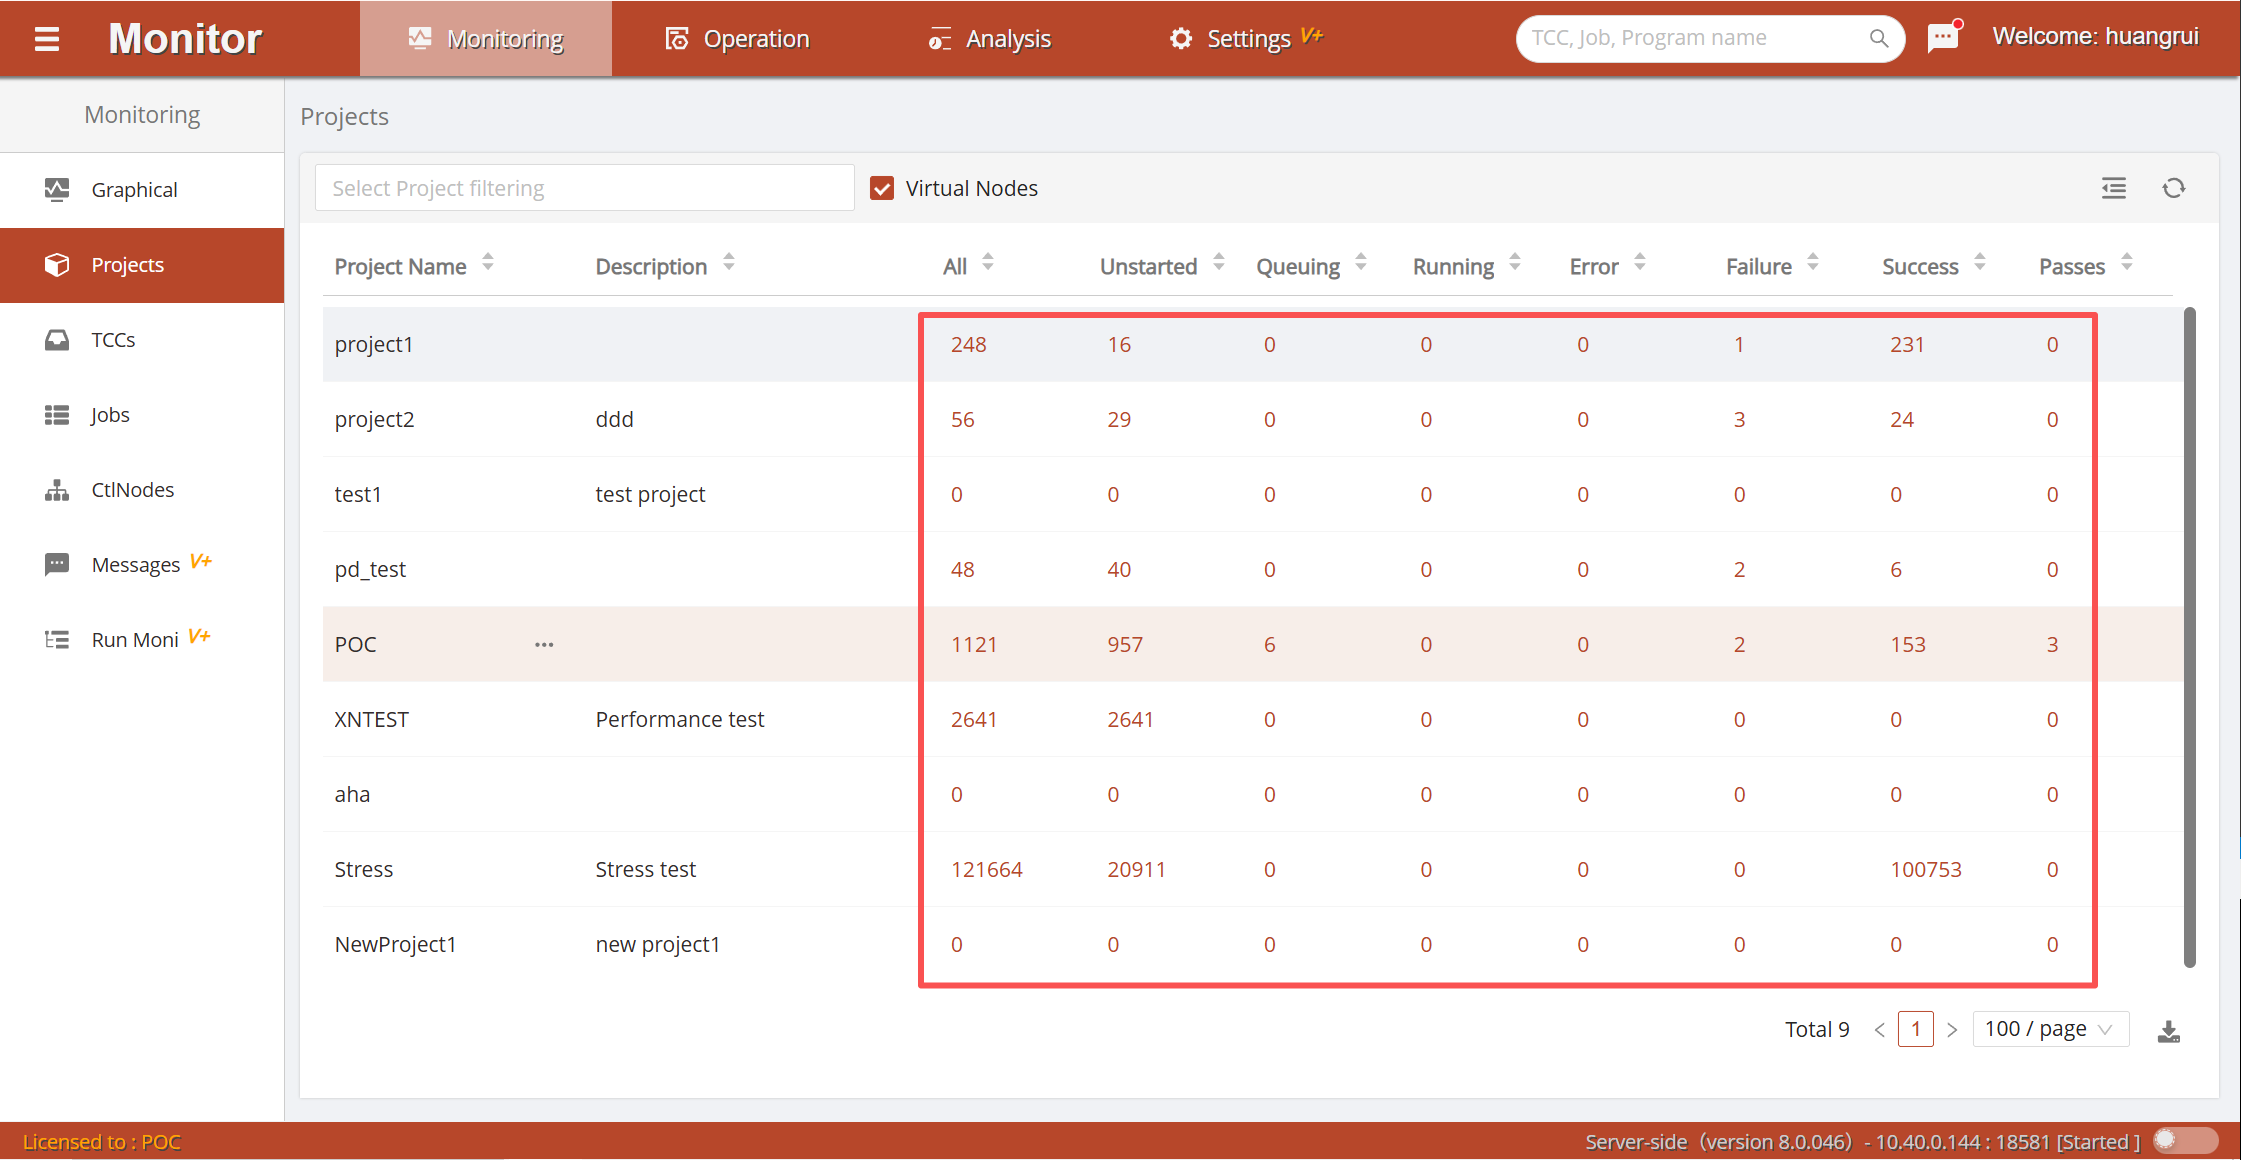
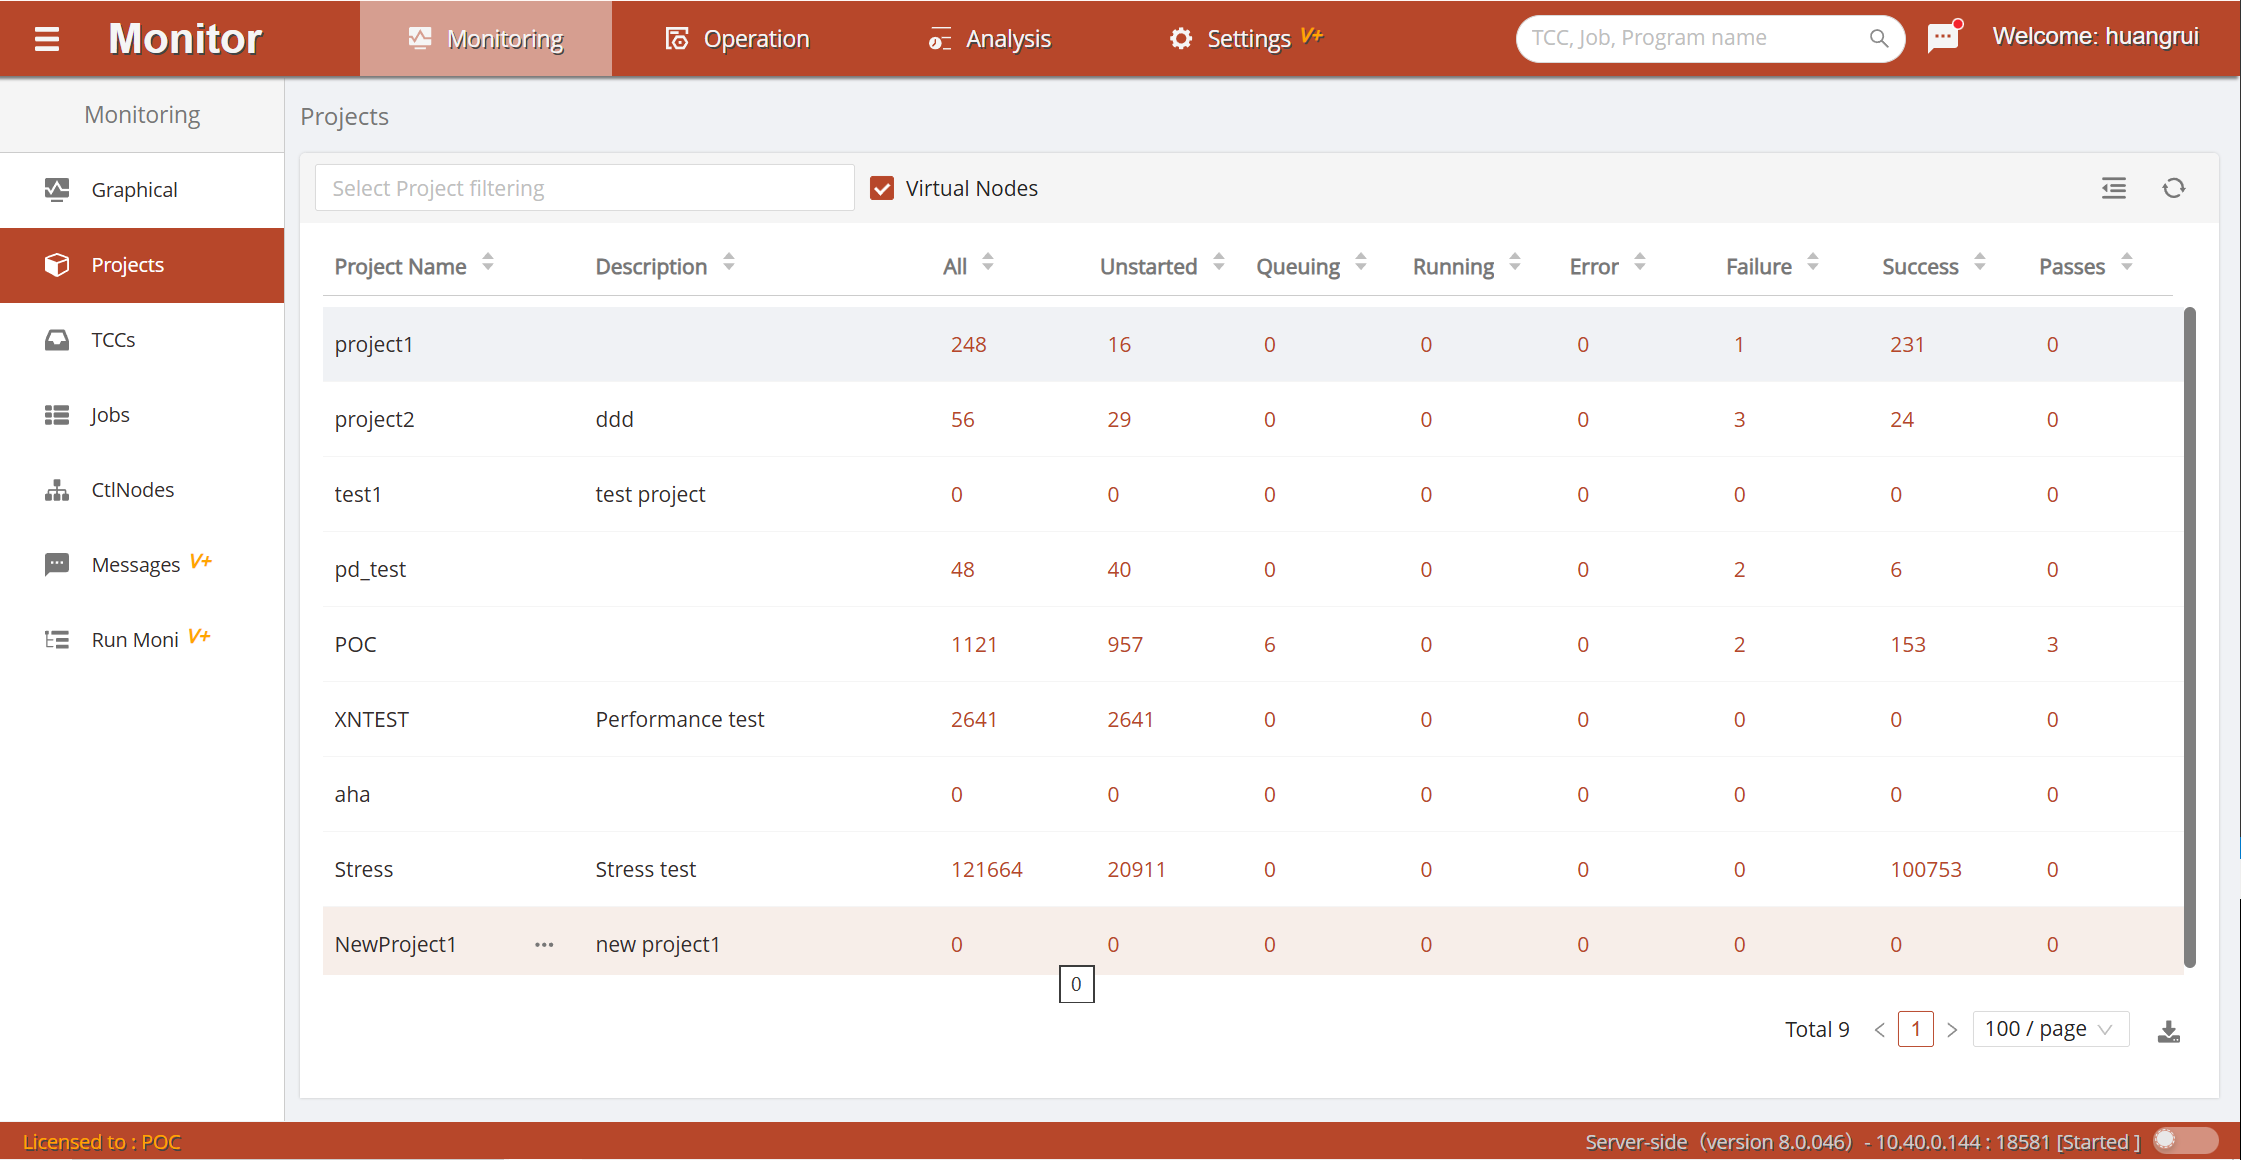 Click the
job status number to jump to the Job Monitoring page and display the job monitoring list data for the specified status under the current project.
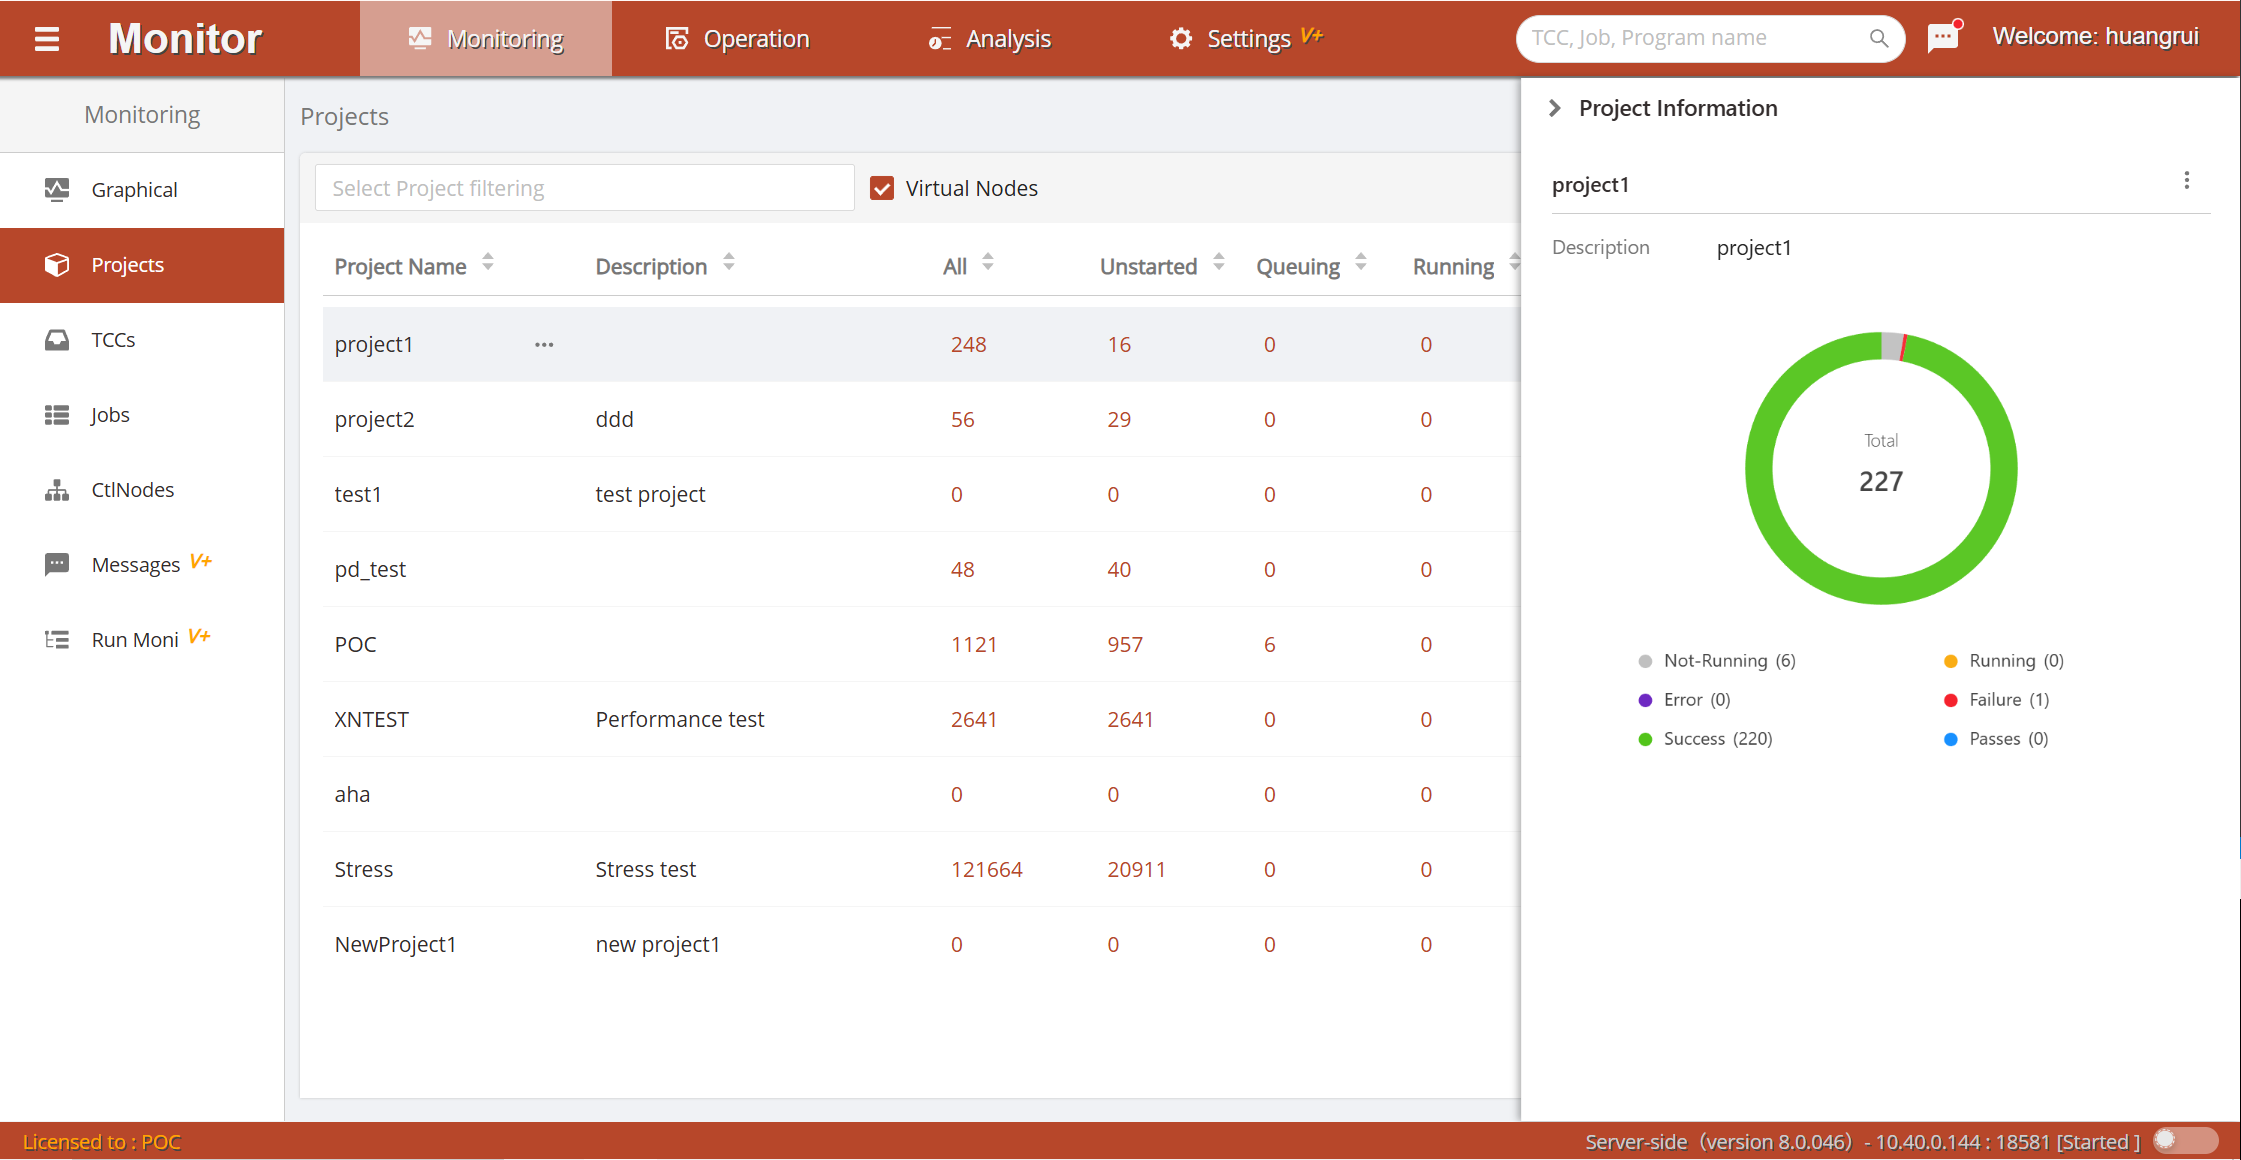
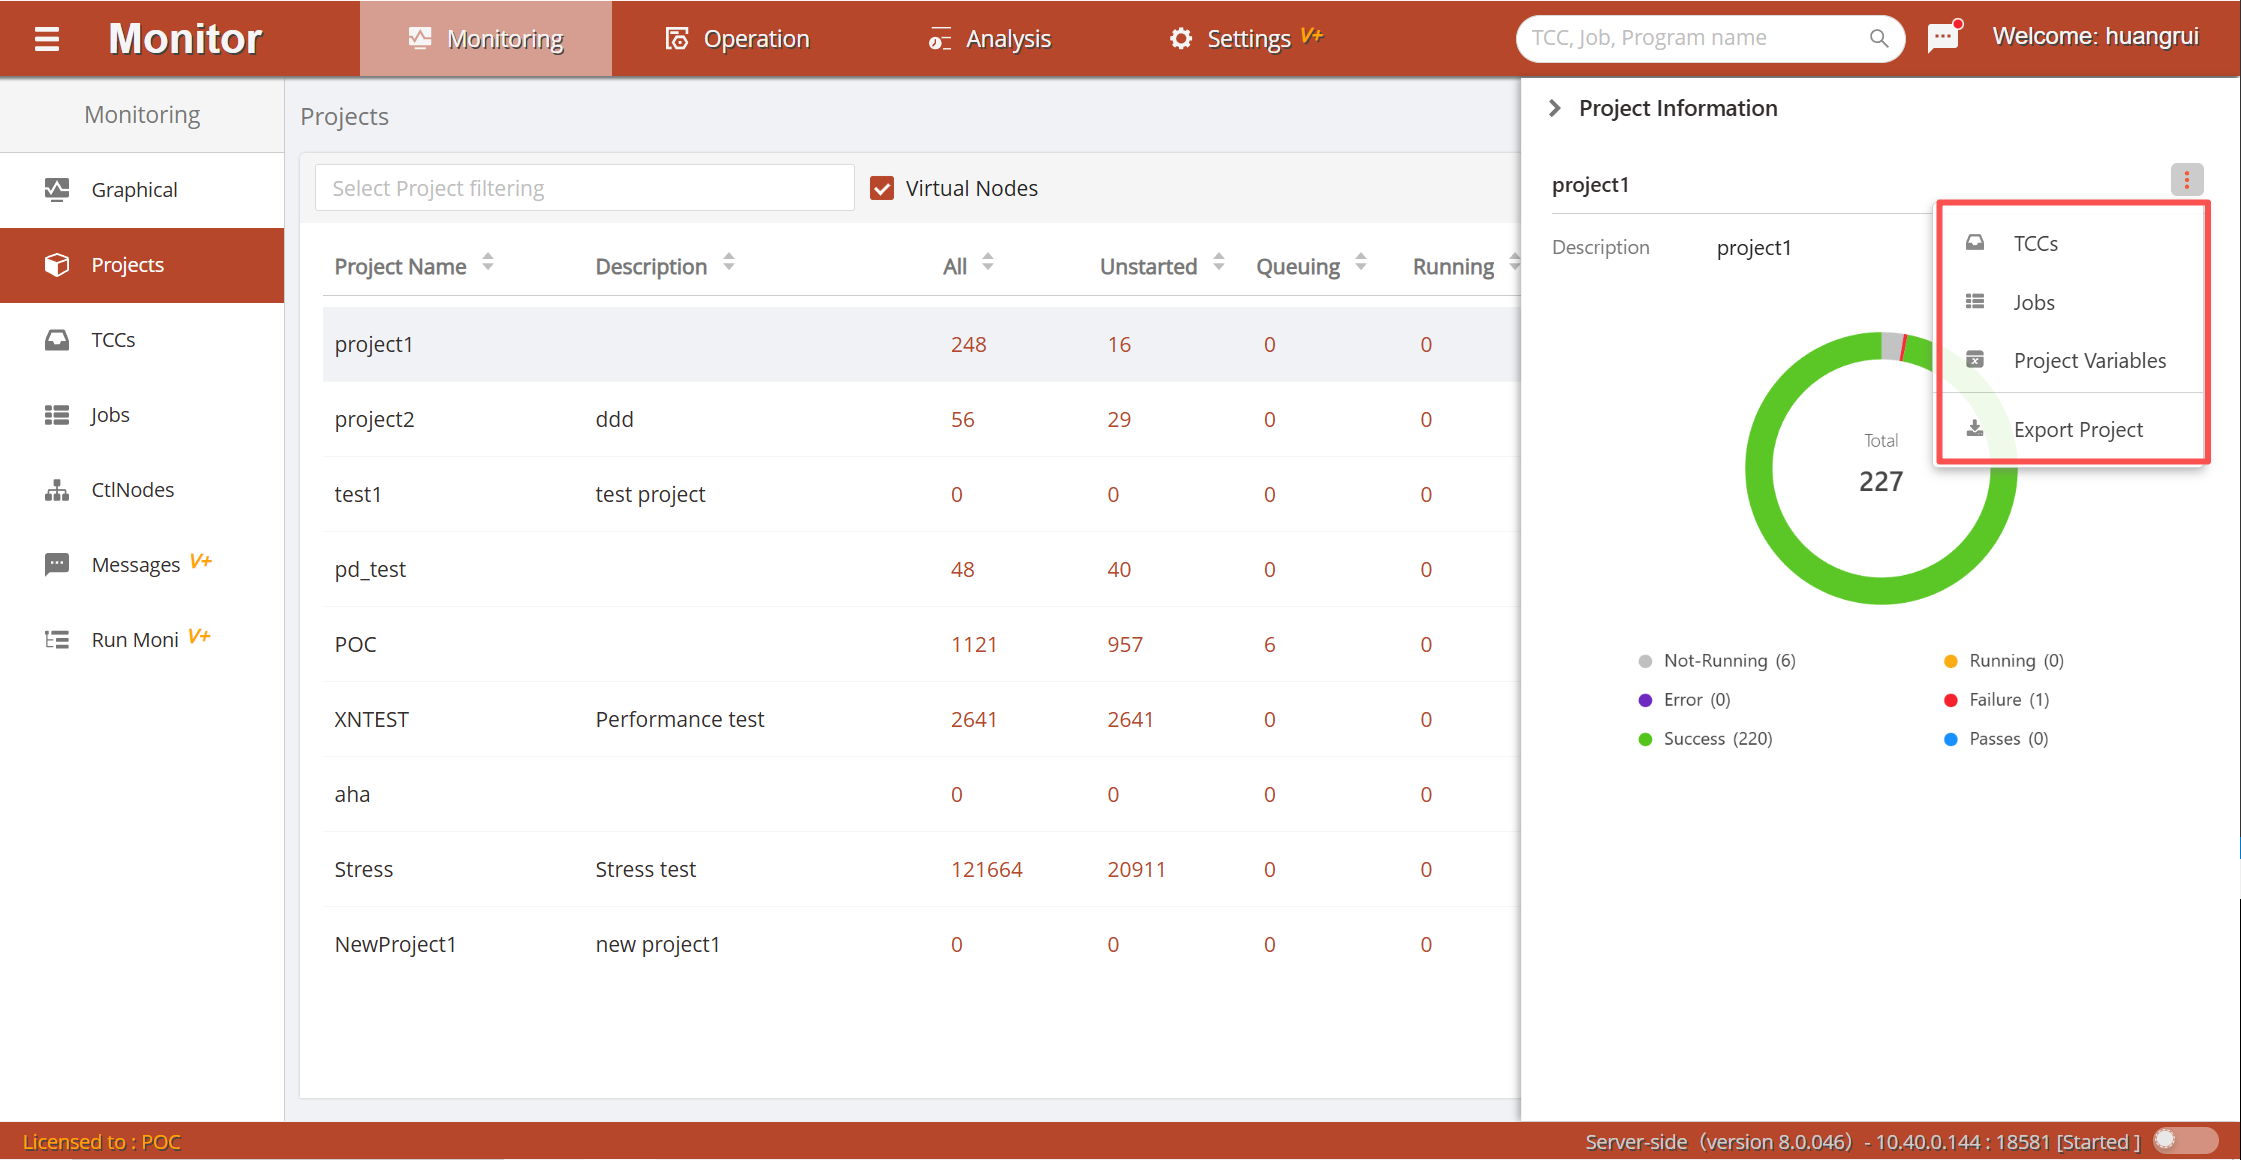
 Double-click on a data row to open the current application project's sidebar window. A donut chart is used to display the proportional distribution and count of job running statuses for the current project.
 Click the button in the upper-right corner of the sidebar window
 to open its command menu, which can directly jump to the corresponding job container page, job list page, and project variables page.
Container Monitoring
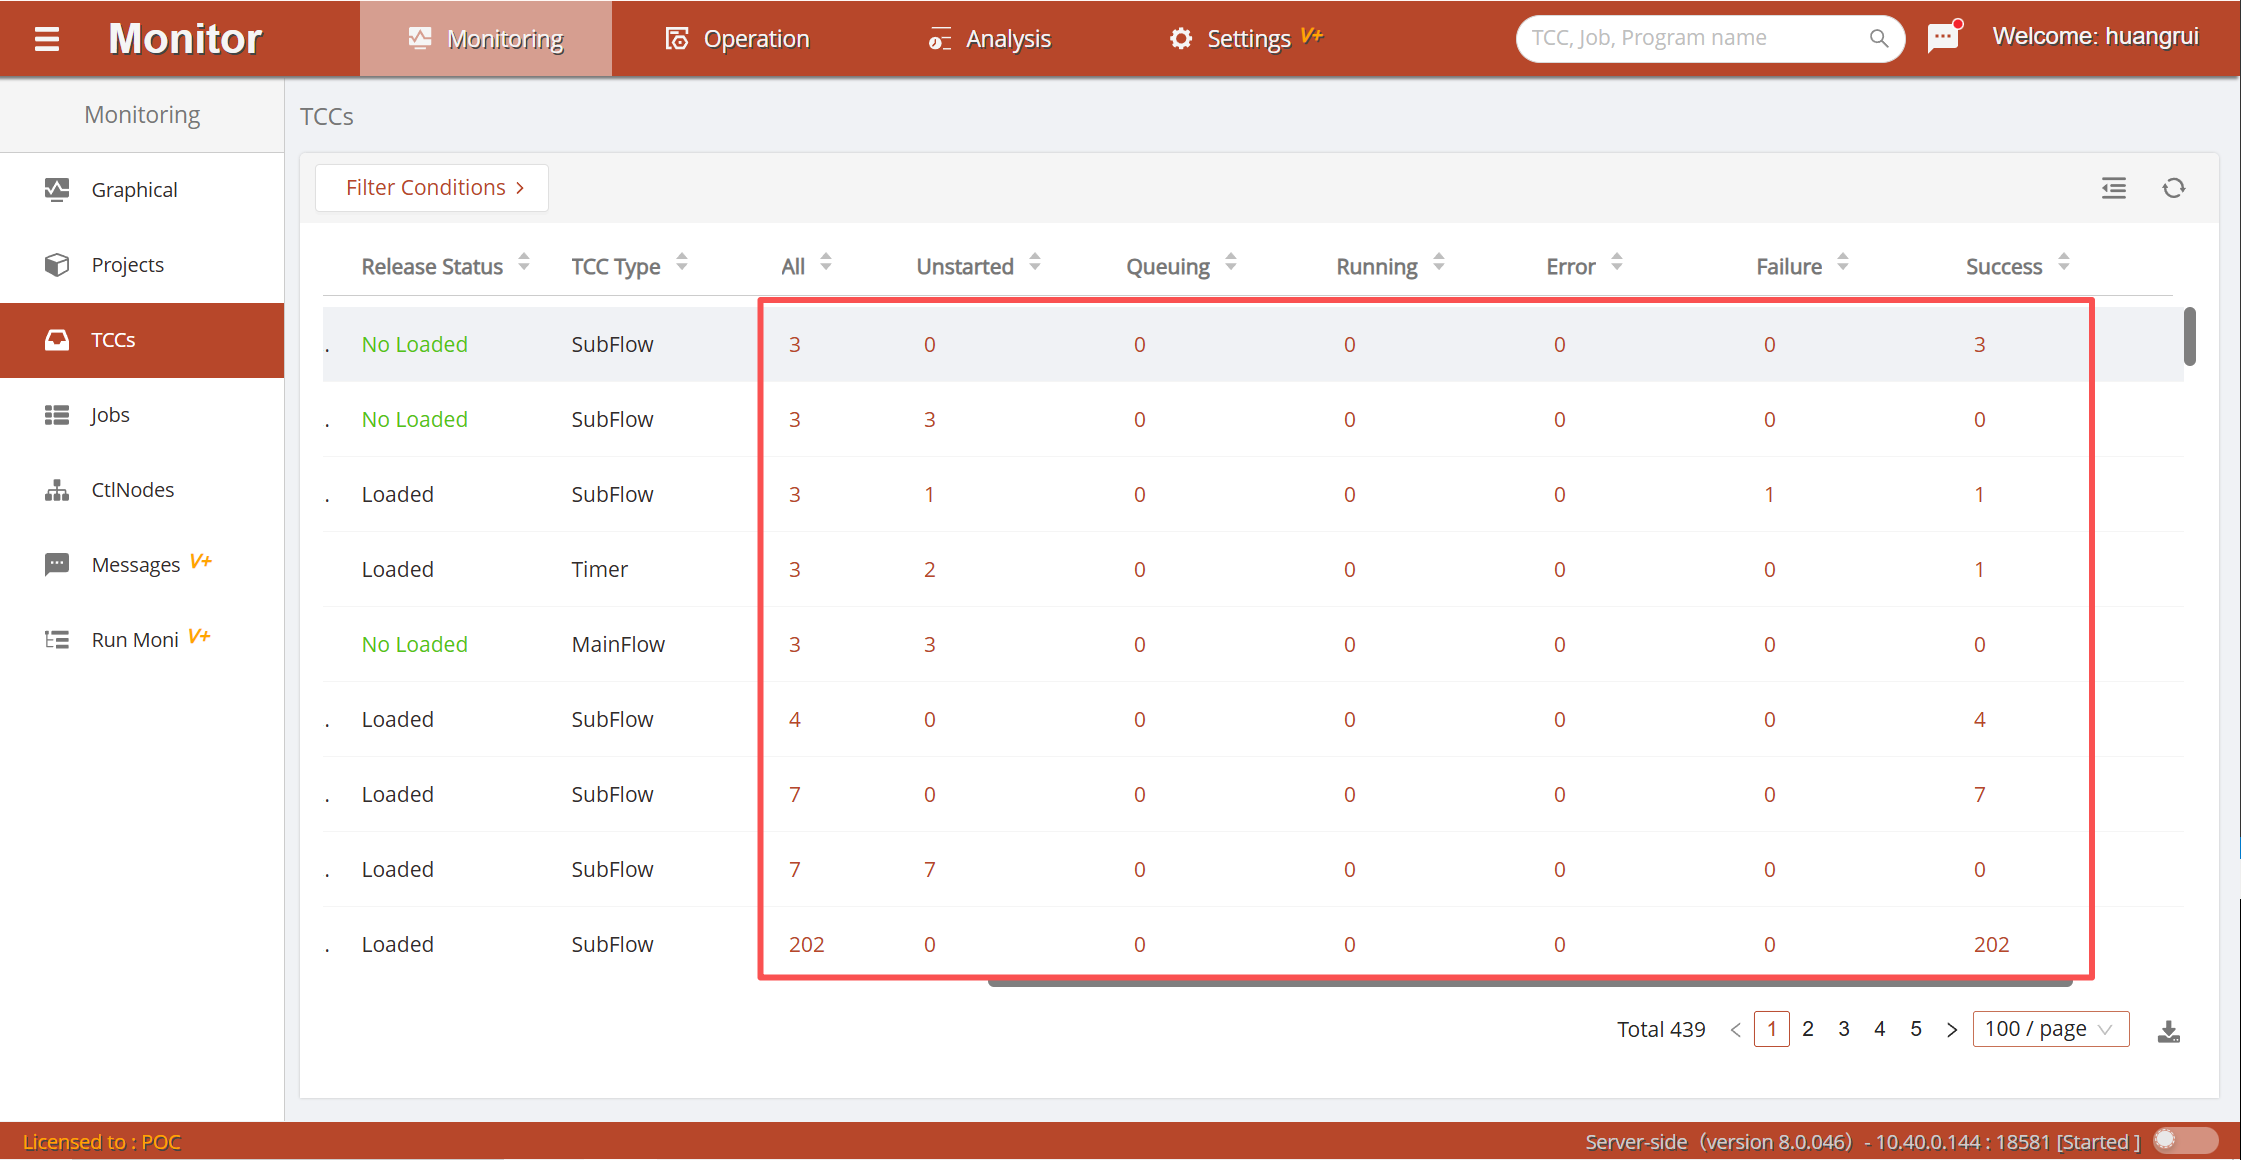
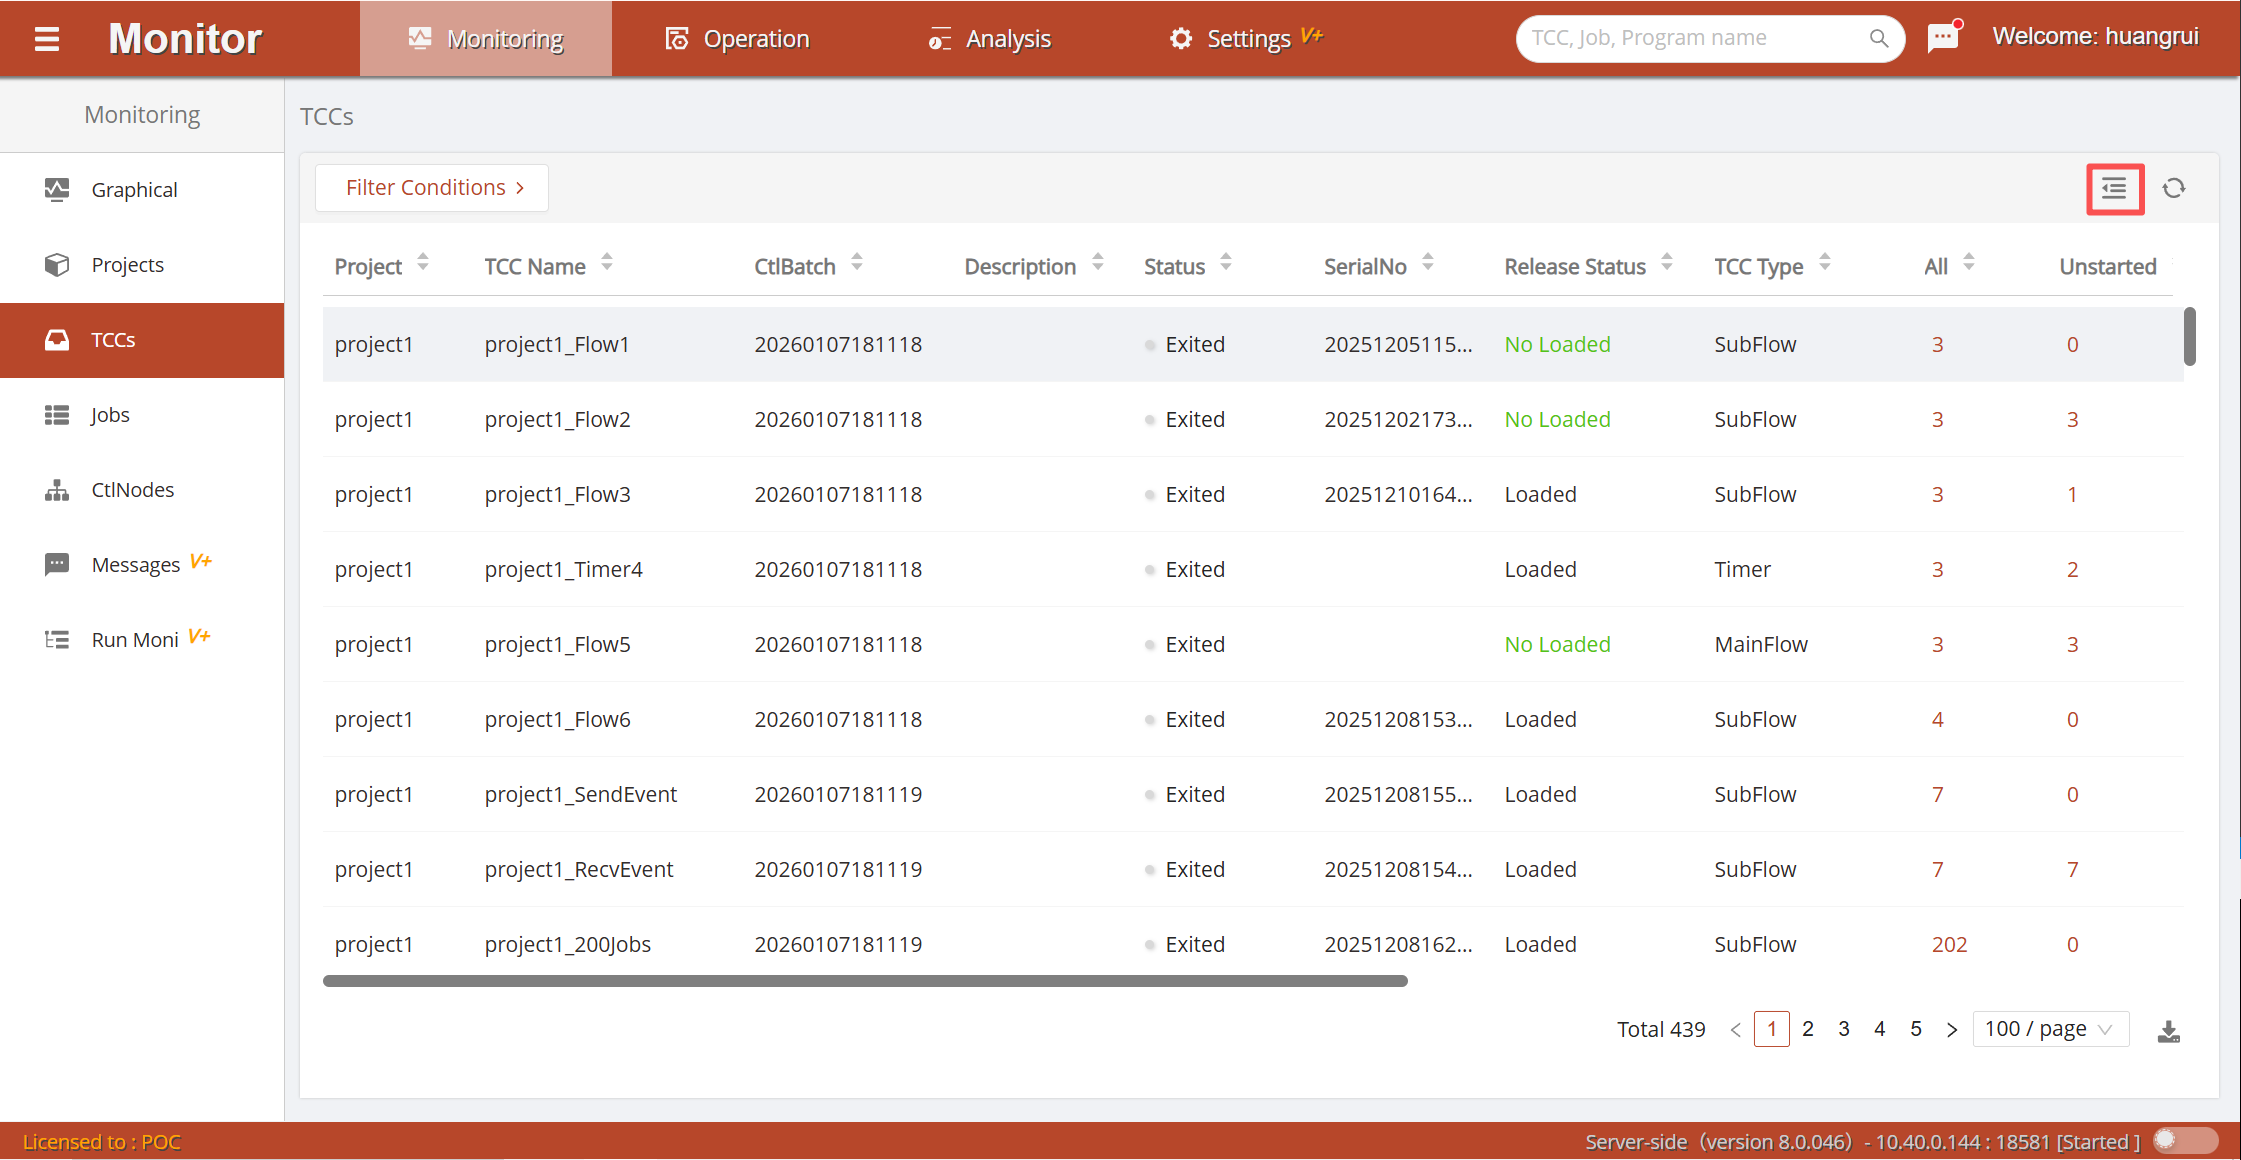
Container monitoring uses Job Containers as the metric and job running status as the dimension. It provides real-time statistics on the count and summary of different job execution statuses under each Job Container. Additionally, the job container list also displays the running status and batch information of job containers.
You can further filter the list data through the toolbar's Application Project and Container Type.
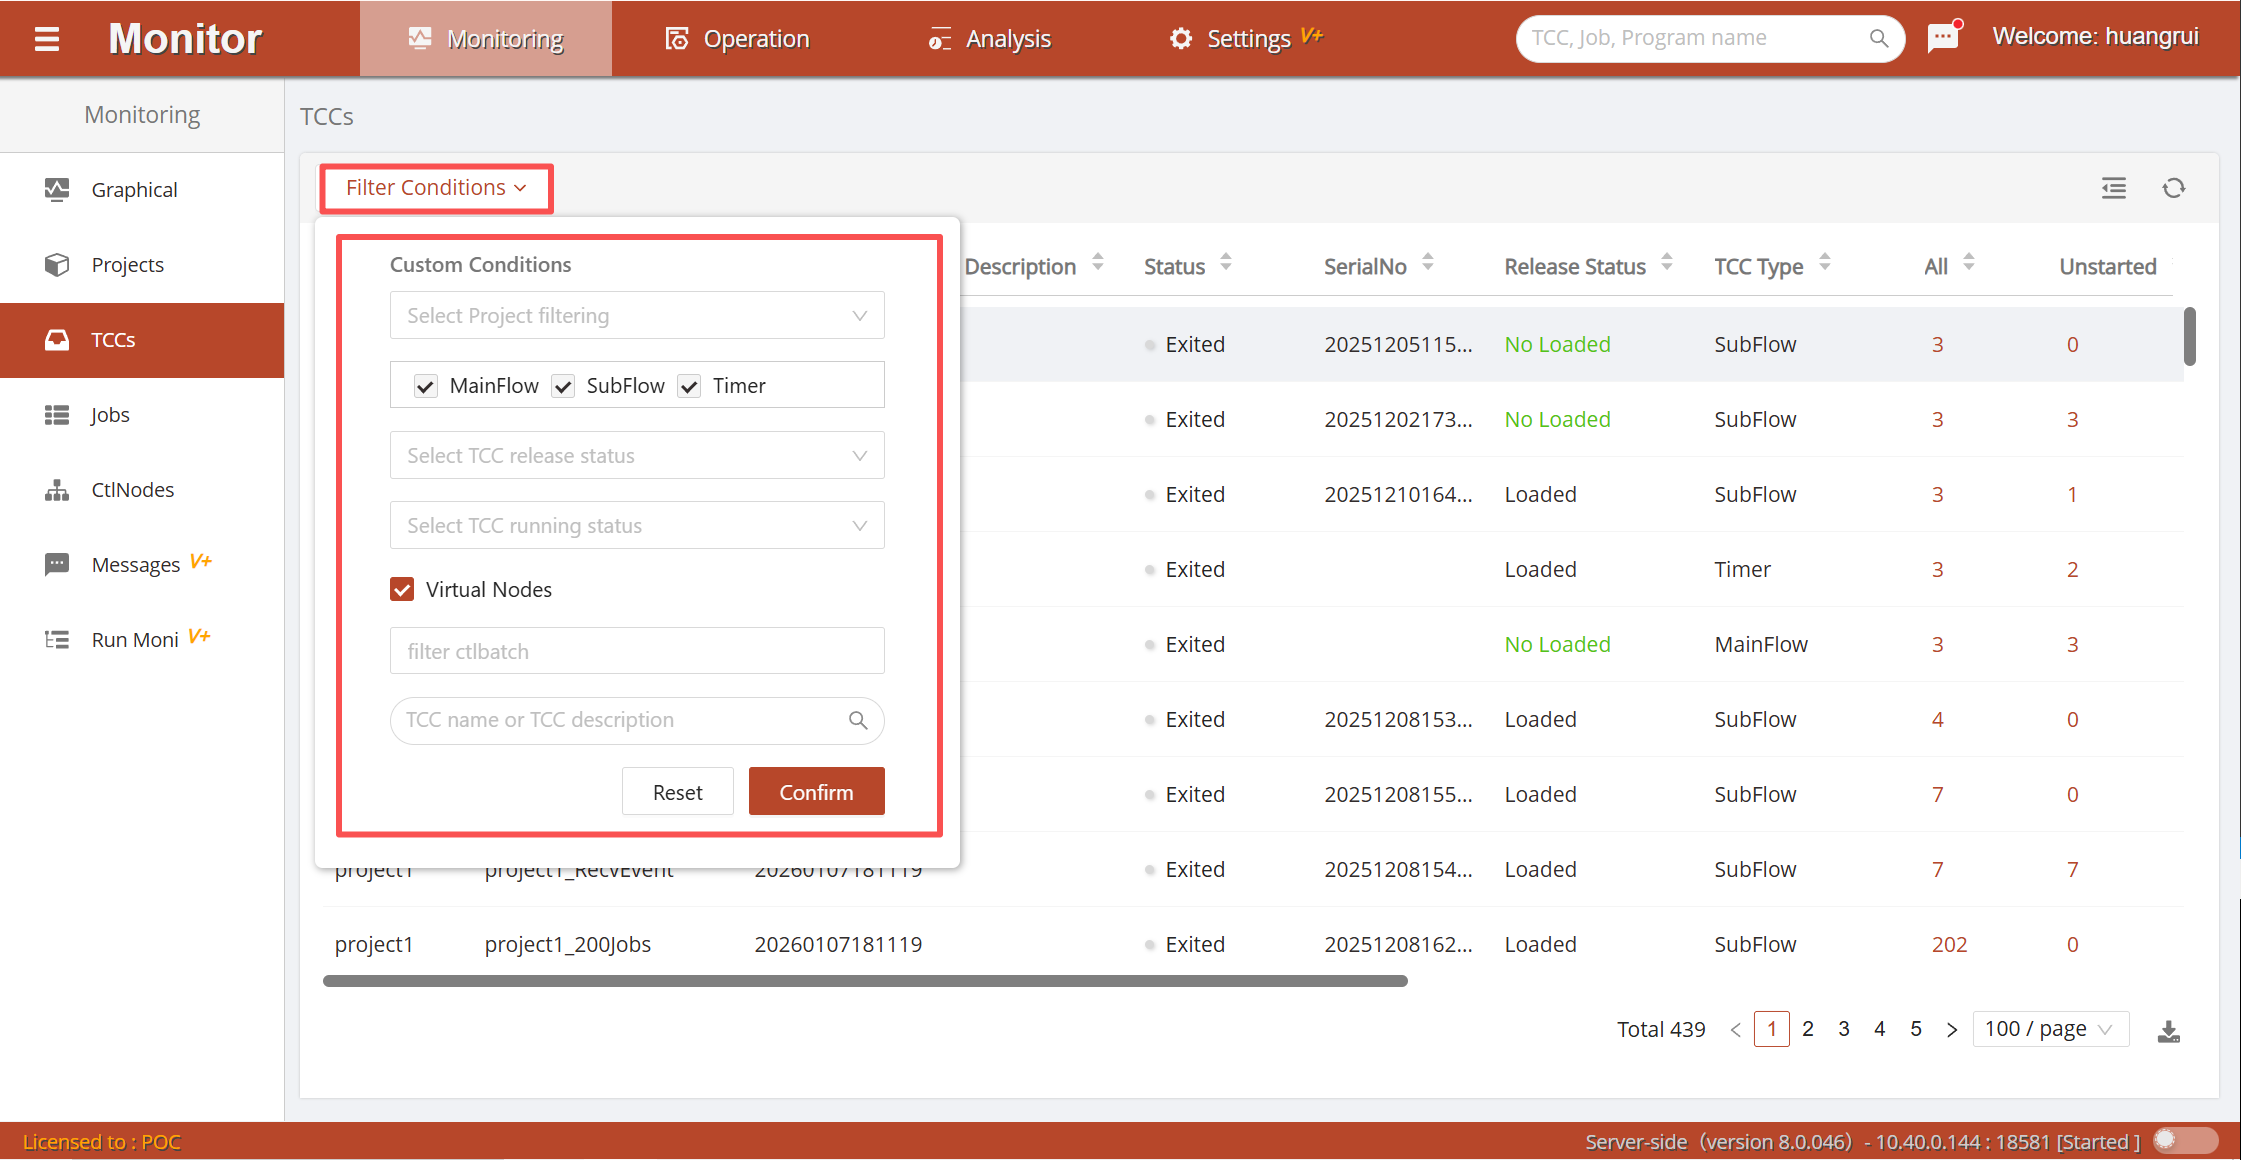
Click the job status number to jump to the Job Monitoring page and display the job monitoring list data for the specified status under the current job container.
Double-click on a data row to open the current job container sidebar window. A donut chart is used to display the proportional distribution and count of job running statuses for the current job container.
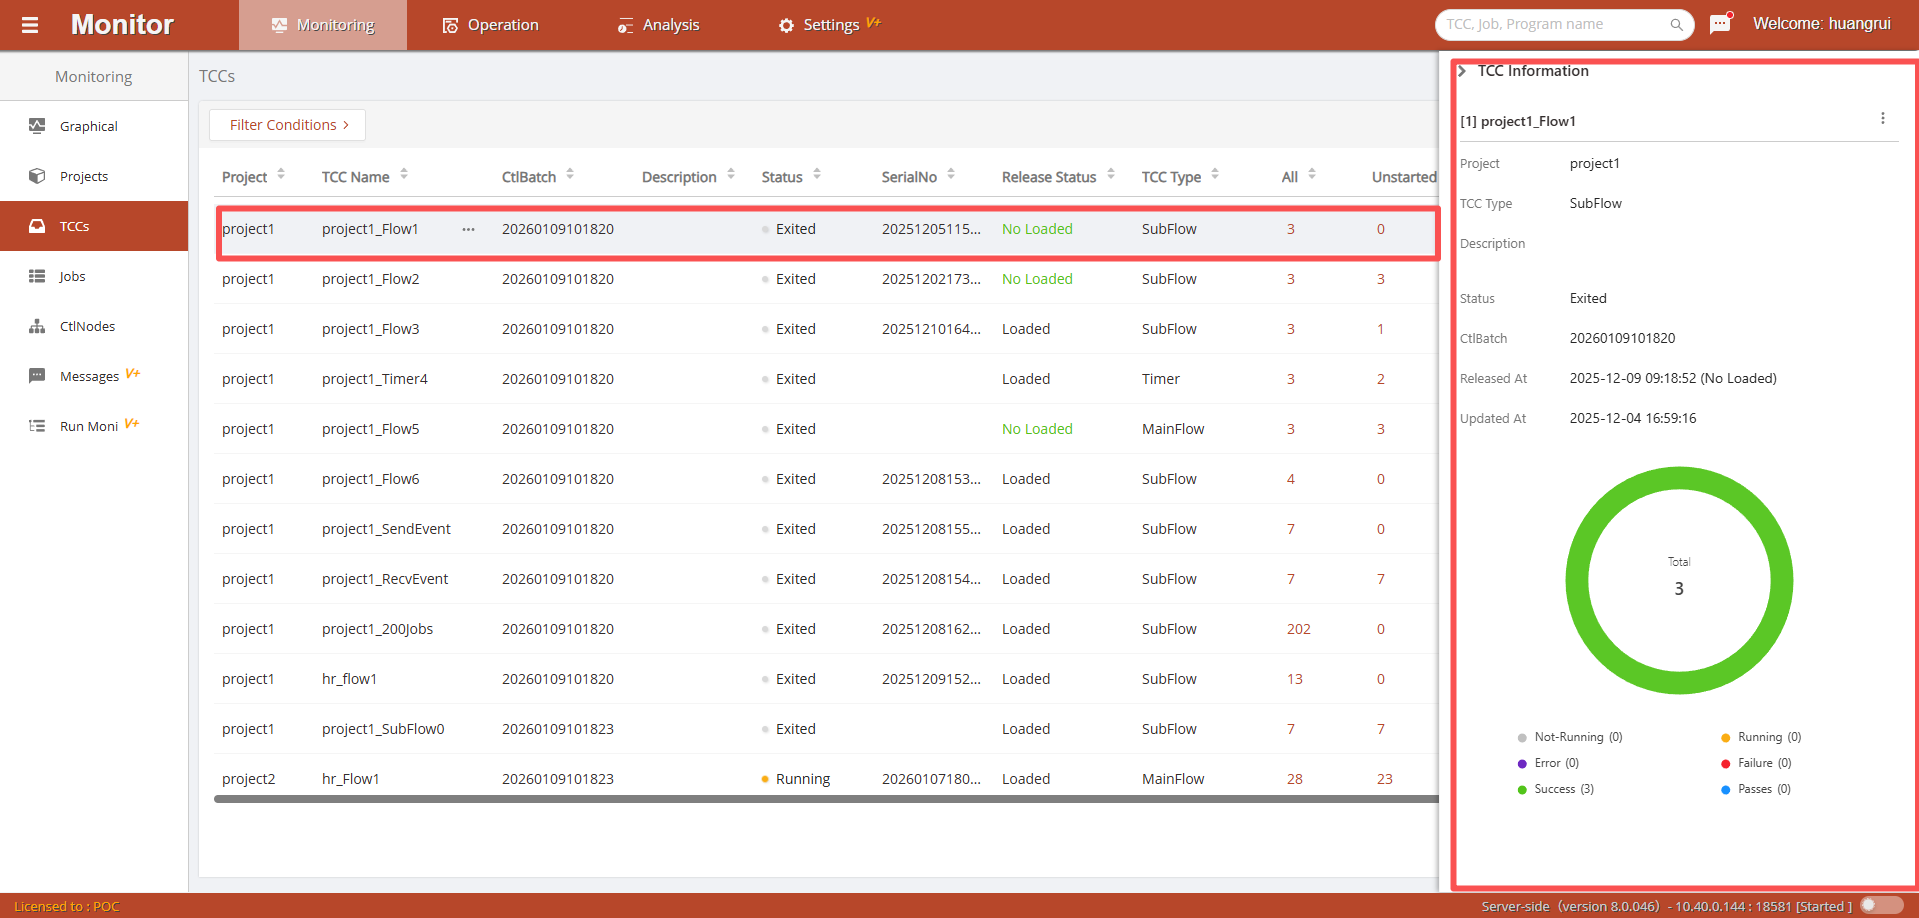
Click the button in the upper-right corner of the sidebar window  to open its command menu for controlling operations and page jumps for the current job container.
Job Monitoring
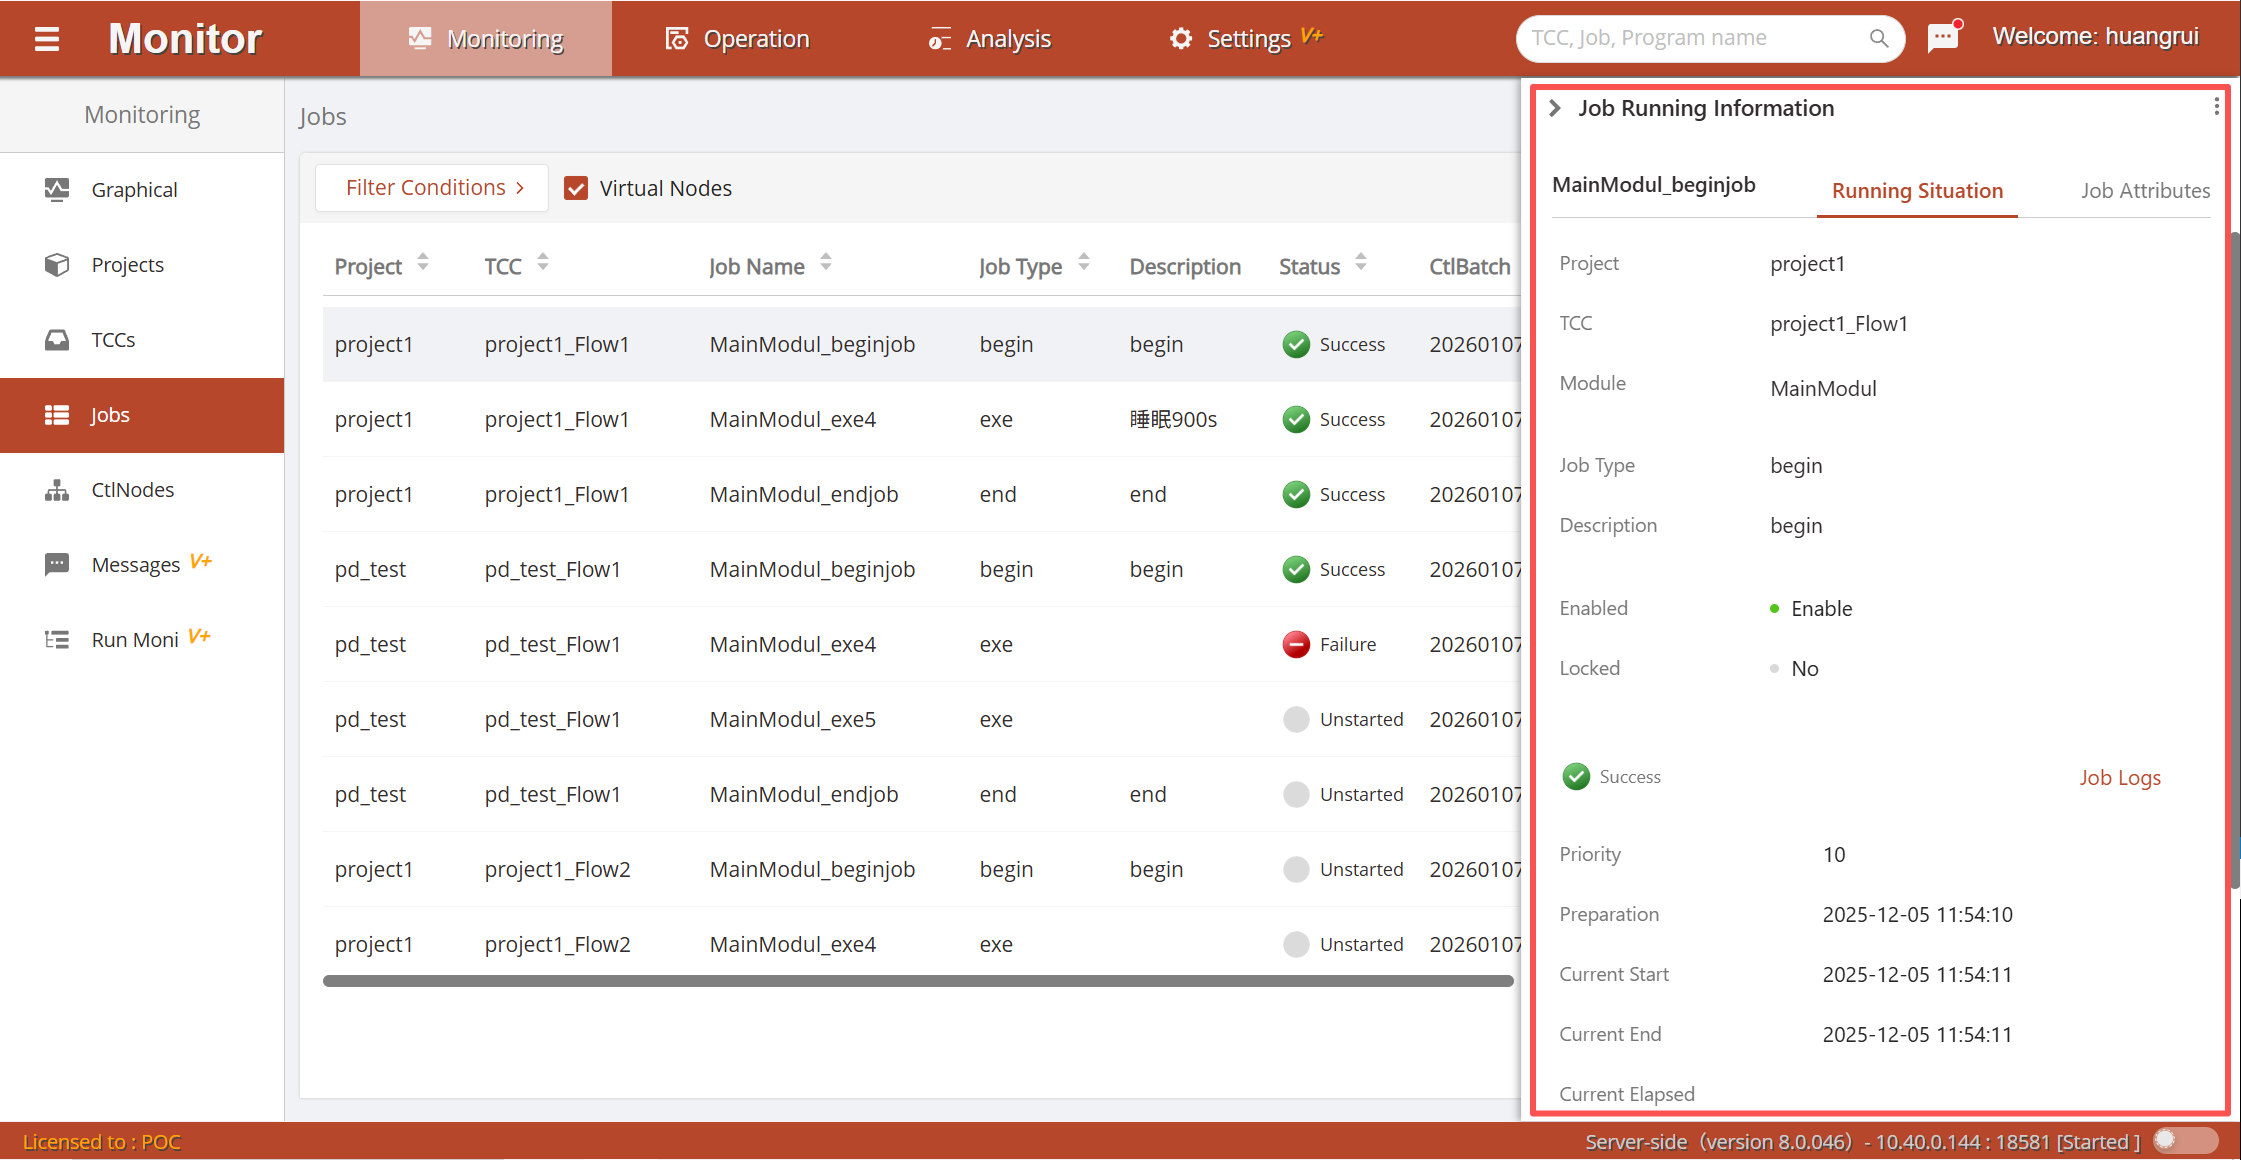
Job monitoring displays detailed real-time running status information of jobs in list form, including dynamic running information and static basic information. The toolbar's Filter Conditions provide multiple condition filtering methods: quick conditions, application project, job container and type, job type, execution agent, and execution status.
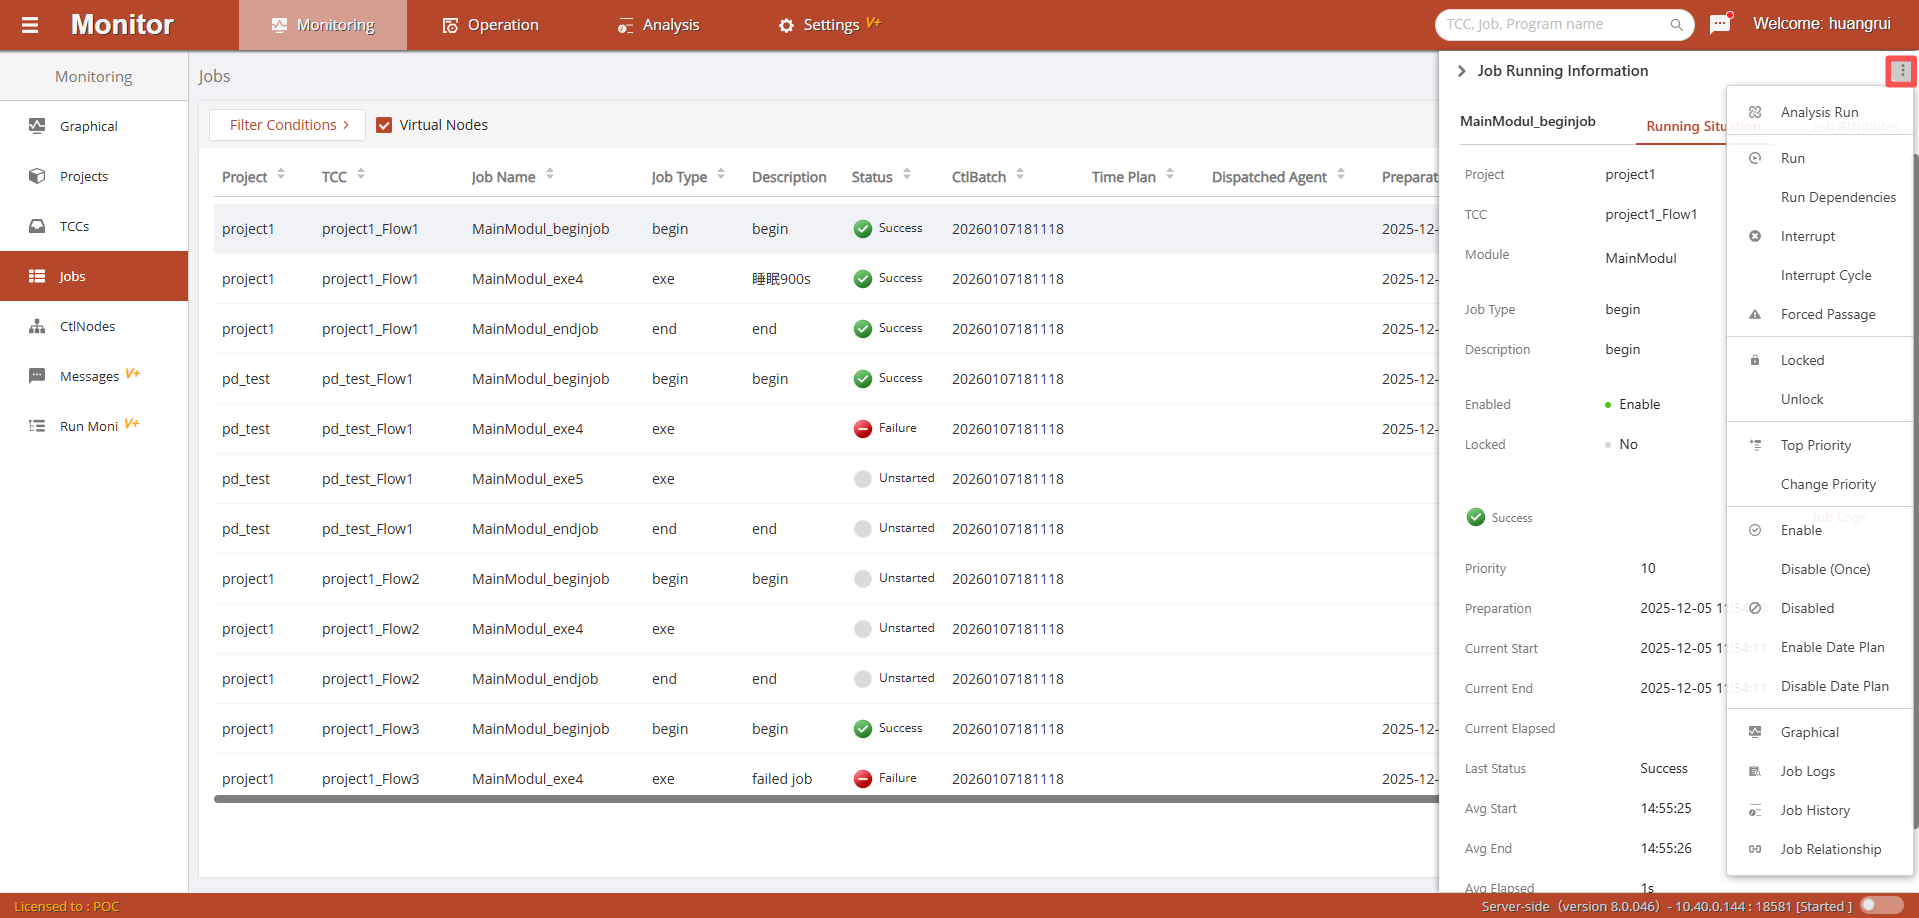
Double-click on a data row to open the current job's sidebar window. For details, please refer to Job Properties Sidebar Window.